Health professionals are using an interactive online mapping tool developed by the Australian Institute of Health and Welfare (AIHW) to improve the services they provide to patients in local communities across Australia.
We know that social and economic conditions affect our health and wellbeing, which means that sometimes local solutions are needed.
Interactive mapping identifying which chronic conditions and their risk factors are most common in a local region, can help health professionals increase their focus on prevention or managing them at an earlier stage.
Chronic conditions, such as type 2 diabetes and cardiovascular diseases are a significant health challenge in Australia. For more than 30 years the AIHW has been monitoring and reporting on chronic conditions, risk factors and health outcomes among the Australian population. The AIHW aims to provide a more complete picture of chronic conditions in Australia through a team of specialised and talented data analysts and public health experts.
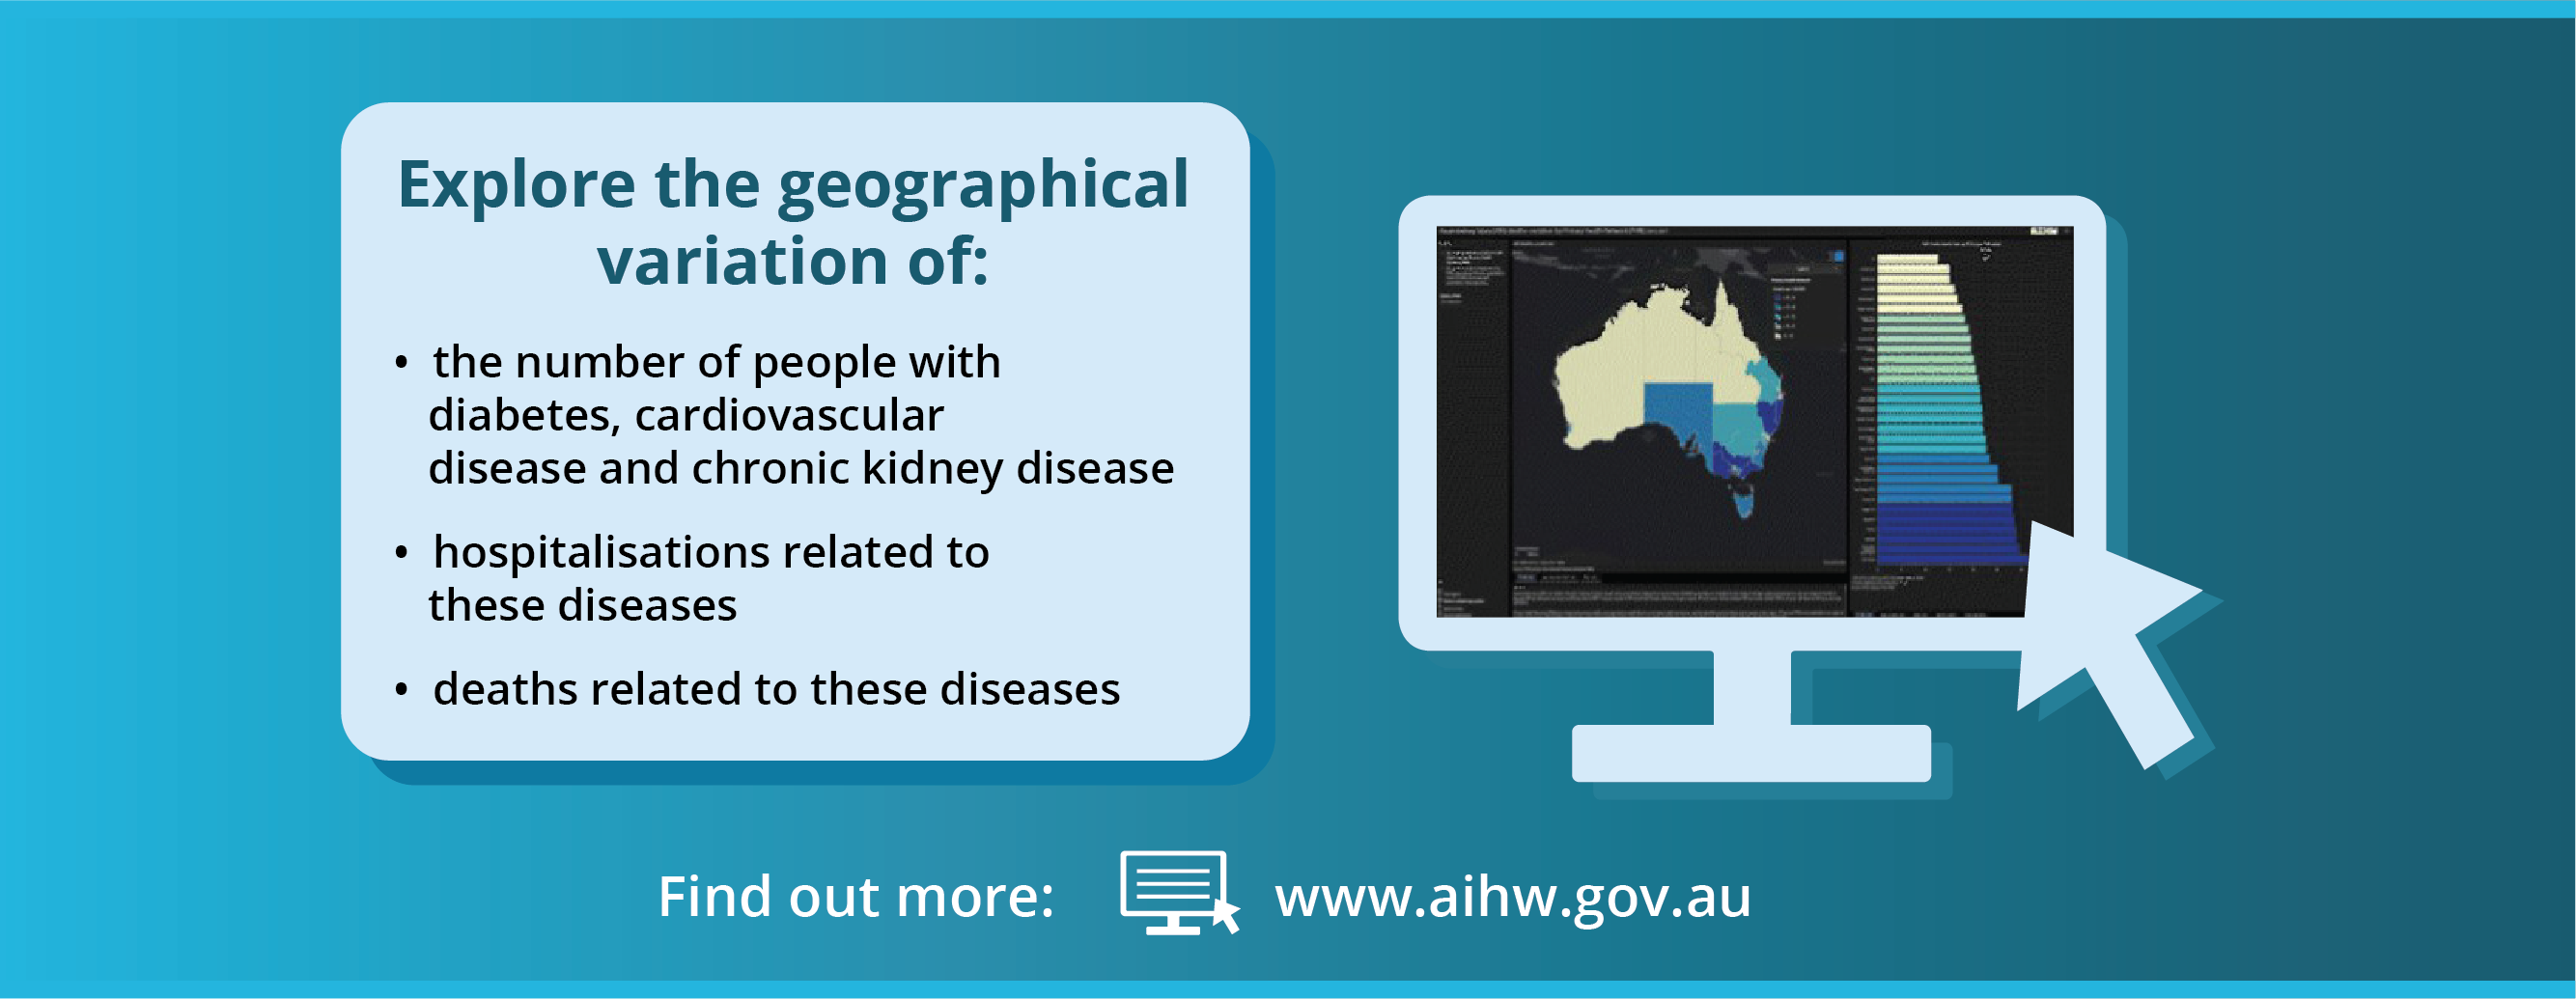
In 2021, the AIHW combined online geospatial interactive mapping technology with national health data on chronic conditions. This was released through a series of interactive maps featuring data across 3 geographical levels. The maps provide health professionals, policy makers, researchers and support services customised insights to inform and develop timely, evidence-based prevention strategies and support services for those living with chronic conditions, such as diabetes, cardiovascular and kidney disease.
The AIHW has a long history of turning raw administrative health data into useful information and telling the broader story of what is going on in our health and welfare system. Geographical variation in disease: diabetes, cardiovascular and chronic kidney disease is the AIHW’s largest online public mapping product to date. There are 36 dynamic online dashboards and 108 maps showing the distribution of the impact of type 2 diabetes, cardiovascular and chronic kidney disease (including acute kidney injury and dialysis).
So how can healthcare providers and other stakeholders benefit from these maps at their fingertips?
Inala Primary Care, a local practice based in Brisbane, Queensland, assessed its patient community against local and national prevalence using the AIHW’s data, finding it had nearly 3 times the rate of people living with diabetes as the national average.
Using the evidence, they put forward a case to increase funding into primary care to prevent, detect and better manage the disease rather than treating end stage complications.
The dashboards successfully informed an integrated model of care between the local tertiary hospital diabetes team and the practice.
‘Evaluation of the beacon clinic found the model to be more cost effective than hospital-based care, triggering a multi-year contract for provision of out-patient replacement services at the practice, ' said Tracey Johnson, CEO of Inala Primary Care.
‘The Inala case study shows the power of national datasets which can be interrogated at local and regional levels. Comparative data enables identification of hotspots for disease, assessment of options for intervention and justification of changes in models of care.
Whilst Australia can celebrate large drops in morbidity and mortality, the benefits have not been evenly shared.'
Substantial progress has been made over many decades in improving the health of Australians related to diabetes, cardiovascular and kidney disease. Death rates are falling, levels of certain risk factors have improved and there have been advances in prevention, treatment and management. Tracking progress in hotspots over time will be vital in tracking the success of health innovation and reform.