Mental health
Consumer outcomes in mental health care
On this page:
This page shows information about the mental health-related problems experienced by consumers of Australian public mental health services and whether they show improvement, no change, or deterioration in their clinical status and functioning from receiving care. Clinical outcomes are just one aspect of a consumer’s treatment and recovery.
Information is collected using clinical measures that have been completed by clinicians or by consumers. Service settings include ambulatory (community) services and inpatient (admitted hospital) services.
Key points
In one year in Australia:
Source: National Outcomes and Casemix Collection Database, 2021–22
Data downloads:
Data quality statement: National Outcomes and Casemix Collection 2021–22; National Outcomes and Casemix Database, 2023.
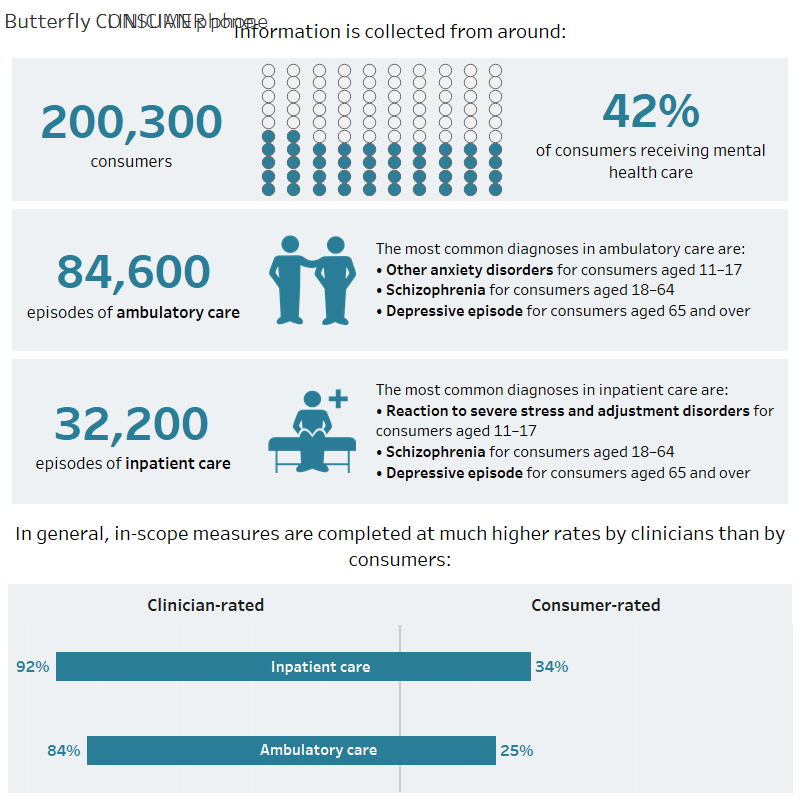
Mental health treatment and support services have an important role in the treatment and recovery of people with mental illness. The National Outcomes and Casemix Collection (NOCC) collects information using measures completed by clinicians and consumers about a person’s clinical status during their mental health care. In one year, information is collected from around 200,000 people across Australia, which is about 42% of people who received care from public sector specialised mental health services.
Since 2014–15, the most frequent mental health-related problems affecting consumers are Emotional problems for adolescents, and Depressed mood and Other mental and behavioural problems for adults. Mental disorder not otherwise specified was among the most frequent principal diagnoses recorded at discharge for all age groups in the latest year of data and its frequency has increased over the past 8 years. This diagnosis may be used when a person presents to a service for care but further investigation is required by clinical staff to make a more specific diagnosis. Depressive episode remains among the five most common principal diagnoses but its frequency has decreased over the same period of time.
Clinical outcomes can be calculated for care episodes where clinical measures have been completed twice (by consumers or clinicians) resulting in a ‘matched pair’. This data can be used to show whether consumers show improvement, no change or deterioration from mental health care.
Measures are completed at much higher rates by clinicians than by consumers. Since data was first reported, each year a higher proportion of consumer episodes show:
- Improvement compared to other outcomes if the consumer had completed acute inpatient care.
- Improvement compared to other outcomes if the consumer was aged 11–64 years and had completed ambulatory care.
- No change compared to other outcomes if the consumer was still receiving ongoing ambulatory care.
Episodes showing Deterioration are the least common outcome compared with other clinical outcomes across all consumer groups. This outcome is more frequent in ongoing ambulatory care compared to other consumer groups. In the latest year of data, there was Deterioration in up to 17% of episodes (for consumers aged 18–64 years) in ongoing ambulatory care.
Data obtained using the NOCC provide valuable information about the outcomes of people accessing Australian public mental health care and enables reporting under the Key Performance Indicators for Australian Public Mental Health Services. Data collection, reporting and development under the NOCC have been in place for two decades and continue due to significant ongoing collaboration between state/territory governments, the Australian Government Department of Health and Aged Care, the Australian Institute of Health and Welfare, and the Australian Mental Health Outcomes and Classification Network.
Spotlight data
Interactive NOCC.Spotlight: Horizontal stacked bar chart, showing per cent of completed episodes with clinician-rated outcome types for consumers, by consumer group, during 2021–22. Each tab shows information for a specific age band. People aged 11 and older showed significant improvement more often after admitted than ambulatory care. Most people aged 11–64 years showed significant improvement after care in completed episodes in both admitted and ambulatory settings. Generally, people aged 65 and older showed no significant change after ambulatory care. Data source: National Outcomes and Casemix Collection (NOCC), refer to NOCC Tables 21, 23 and 25.
Who is included in the NOCC?
All people who receive clinical care in public sector specialised mental health services are in-scope to be included in the NOCC. Since 2014–15, NOCC measures are collected for more than 41% of people who receive care from public sector specialised mental health services (Table NOCC.1).
Figure 1 shows the demographic characteristics of consumers in the NOCC. The term ‘First Nations people’ is used in this report to refer to people identified as being of Aboriginal and/or Torres Strait Islander origin.
Figure NOCC.1: Demographic characteristics of consumers
Figure NOCC.1: Horizontal bar chart including 95% confidence intervals, showing the per cent of consumers included in the National Outcomes and Casemix Collection (NOCC) by consumer demographics, during one year, 2014–15 to 2021–22. Refer to NOCC Table 2.

Notes:
- Black bars representing 95% confidence intervals are displayed. For more information, refer to Notes to interpret the data.
- Per cent of consumers in the NOCC.
- Children aged 10 years and under account for 3% of all consumers in the NOCC. As this is a relatively small number of consumers, the ability to undertake comprehensive reporting and disaggregation is limited. As such, data relating to children aged 10 years and under are not further reported in this section. Reports can be generated via other NOCC reporting products (Web Decision Support Tool and Reports Portal).
Mental health legal status indicates whether a person is treated on an involuntary basis under the relevant state or territory mental health legislation during an episode of care. Figure 2 shows the proportions for involuntary care recorded at discharge.
Overall, during 2021–22, Involuntary status was recorded for higher proportions of discharge collection occasions in acute inpatient care than in ambulatory care – up to 40% for inpatient and up to 12% for ambulatory, depending on age (Figure NOCC.2). This is consistent with the proportions of involuntary treatment reported by states and territories under the Key Performance Indicators in Public Mental Health Services. For more information about Involuntary mental health visit the involuntary care section in this report.
The proportion of discharge collection occasions under involuntary care in admitted settings has been decreasing from 2014–15:
- from 22% to 15% for people aged 11–17 years,
- from 48% to 40% for people aged 18–64 years, and
- from 45% to 37% for people aged 65 years and over.
Figure NOCC.2: Proportions of involuntary mental health care are higher for acute inpatient care compared with ambulatory care
Figure NOCC.2: Horizontal bar chart including 95% confidence intervals, showing the per cent of discharge collection occasions in the National Outcomes and Casemix Collection (NOCC) where mental health legal status was recorded as involuntary, by age band and setting during one year, 2014–15 to 2021–22. Acute inpatient collection occasions had higher proportions of involuntary mental health legal status than ambulatory care. Refer to NOCC Table 11.

Notes:
- Black bars representing 95% confidence intervals are displayed. For more information, refer to Notes to interpret the data.
- Per cent of discharge collection occasions where mental health legal status was recorded as involuntary.
Clinical issues for consumers
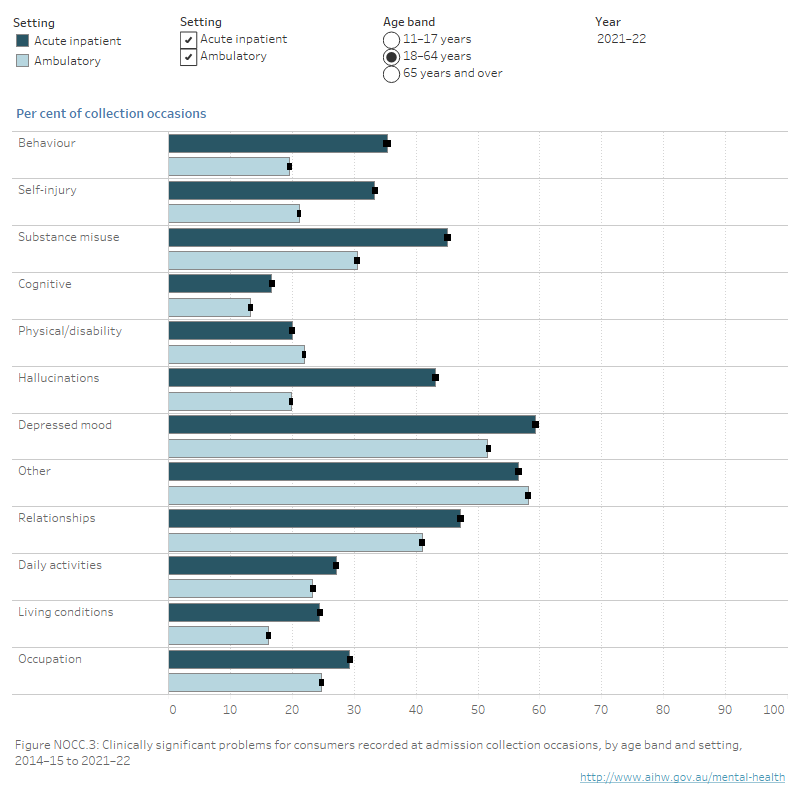
Many consumers in all age bands face more than one clinically significant problem. Overall, Emotional problems (adolescents) and Depressed mood (adults) are common along with Other mental health and behavioural problems for adults, indicating the presence of comorbid problems (Figure NOCC.3).
Proportions of clinically significant problems vary across settings and age bands. Across all age bands, mental health-related problems of Self-injury, Hallucinations and Substance misuse are more common in acute inpatient settings than in ambulatory settings.
Children and adolescents (11–17 years)
Self-injury has been among the most common mental health-related problems affecting consumers aged 11–17 years since 2014–15. In 2020–21, Self-injury surpassed Family problems and became the second most common problem in admitted settings (70% of collection occasions in 2021–22). Similarly, in ambulatory care, Self-injury increased from 39% of collection occasions in 2014–15 to 49% in 2021–22. Other mental health-related problems affecting consumers aged 11–17 years are Emotional, Family and Peers problems.
Adults (18–64 years)
The mental health-related problems most commonly affecting consumers aged 18–64 years are Depressed mood (around 59% of collection occasions in acute inpatient care), and Other mental and behavioural problems (around 58% of collection occasions in ambulatory care). The presence of clinically significant problems in Other mental and behavioural problems indicate comorbid problems for the consumer. Relationships and Substance misuse are also rated as clinically significant problems in both settings.
Older persons (65 years and older)
Since 2014–15, the mental health-related problems most commonly affecting consumers aged 65 years and older are Other mental and behavioural problems indicating comorbid problems (63% of collection occasions in acute inpatient, 54% ambulatory), Physical illness or disability problems (49% acute inpatient, 59% ambulatory) and Depressed mood (63% acute inpatient care, 49% in ambulatory care).
Figure NOCC.3: Self-injury, Hallucinations and Substance misuse are more commonly rated as significant problems for consumers in acute inpatient settings compared with ambulatory settings
Interactive NOCC.3: Interactive horizontal bar graph including 95% confidence intervals showing the per cent of admission collection occasions in the National Outcomes and Casemix Collection (NOCC) where clinically significant problems were recorded using the clinician-rated Health of the Nation Outcome Scales for the appropriate age band, by age band and setting, during one year, 2014–15 to 2021–22. Refer to NOCC Tables 8, 9 and 10.
Notes:
- Black bars representing 95% confidence intervals are displayed. For more information, refer to Notes to interpret the data.
- Per cent of admission collection occasions where clinically significant problems were recorded using the clinician-rated Health of the Nation Outcome Scales for the appropriate age band.
Clinical diagnoses for consumers
The principal diagnosis recorded at discharge provides an indication of the treated prevalence of specific mental illnesses in specialised mental health care services. Principal diagnosis is recorded as a code from the International Classification of Diseases and Related Health Problems (ICD-10-AM, 11th Edition).
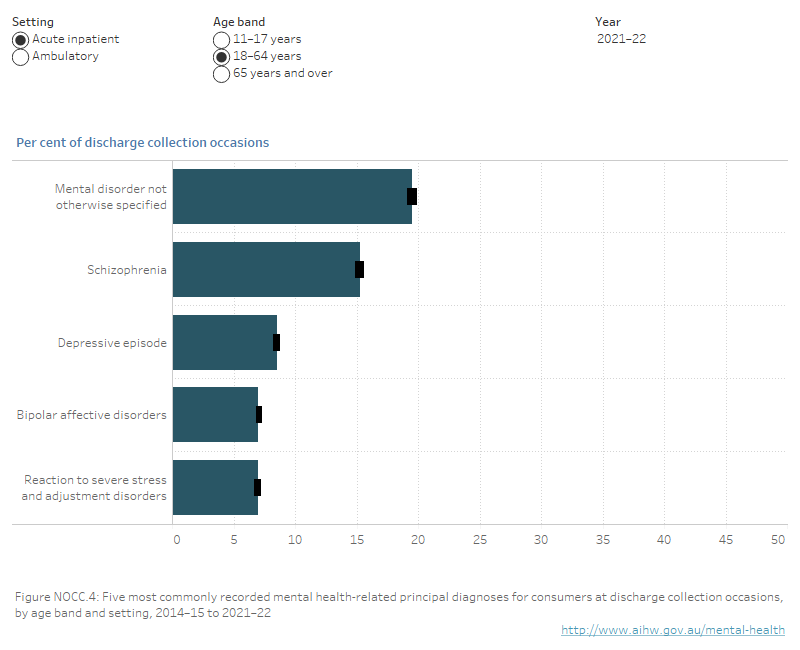
Mental disorder not otherwise specified was among the most frequent principal diagnoses recorded at discharge during 2021–22 for all age bands and settings, and its frequency has been increasing since 2014–15 (Figure NOCC.4). This suggests heterogeneity in the presentation of mental health diagnoses for consumers.
Of specified mental health-related diagnoses, Depressive episode was among the five most frequent principal diagnoses for all age bands and settings. However, the proportions of discharge collection occasions with a principal diagnosis of Depressive episode have decreased over the past 8 years across all ages and settings. In acute settings it has decreased from 23% to 11% for consumers aged 11–17, from 12% to 9% for consumers aged 18–64 and from 27% to 20% for consumers aged 65 and over. In ambulatory settings it has almost halved for consumers aged 11 to 64 and decreased from 23% to 17% for consumers aged 65 and over.
Children and adolescents (11–17 years)
During 2021–22, for consumers aged 11–17, Other anxiety disorders was among the most frequently recorded mental health-related principal diagnoses at discharge (7% of collection occasions in acute inpatient, and 15% in ambulatory), as were Reaction to severe stress and adjustment disorders (15% acute inpatient, 14% ambulatory), Mental disorder not otherwise specified (21% acute inpatient, 20% ambulatory) and Depressive episode (11% acute inpatient, 8% ambulatory) (Figure NOCC.4).
Adults (18–64 years)
During 2021–22, for consumers aged 18–64, Mental disorder not otherwise specified was the most frequently recorded diagnosis at discharge across both settings (20% acute inpatient, 22% ambulatory), and Schizophrenia was the second (15% acute inpatient, 12% ambulatory). In both settings, Depressive episode was also among the most frequently recorded principal diagnoses (9% acute inpatient, 8% ambulatory) (Figure NOCC.4).
Other frequently recorded diagnoses were Reaction to severe stress and adjustment disorders (7% acute inpatient, 11% ambulatory).
Older persons (65 years and older)
In 2021–22, for consumers aged 65 years and older the most frequently recorded mental health-related principal diagnoses at discharge were Depressive episode (20% acute inpatient, 17% ambulatory) and Mental disorder not otherwise specified (14% acute inpatient and 13% ambulatory). In ambulatory settings, the proportion of collection occasions recording Dementia as principal diagnosis has decreased from 19% in 2014–15 to 11% in 2021–22.
Bipolar affective disorders and Schizophrenia were also among the five most frequently recorded diagnoses at discharge in acute inpatient settings.
Figure NOCC.4: Depressive episode remains among the five most common principal diagnoses but its frequency has decreased over the past 8 years
Interactive NOCC.4: interactive horizontal bar graph with 95% confidence intervals showing the per cent of discharge collection occasions in the National Outcomes and Casemix Collection (NOCC) where principal diagnosis was recorded for the 5 most commonly reported principal diagnoses, by age band and setting, during one year, 2014–15 to 2021–22. Refer to NOCC Table 12.
Notes:
- Black bars representing 95% confidence intervals are displayed. For more information, refer to Notes to interpret the data.
- Per cent of discharge collections occasions where principal diagnosis was recorded using the International Classification of Diseases (ICD-10-AM).
Clinical outcomes of care
Clinical outcomes can only be calculated on a subset of episodes in the NOCC dataset – those with a matched pair of collection occasions where the same clinical measure has been completed twice for a particular consumer during an episode of care.
The number of episodes with matched pairs are lower for consumer-rated measures and higher for clinician-rated measures. However, in inpatient settings, the proportion of episodes with matched pairs for consumer-rated measures has increased from 2014–15 to 2021–22:
- from 22% to 35% for consumers aged 11–17 years,
- from 5% to 21% for consumers aged 18–64 years, and
- from 3% to 16% for consumers aged 65 years and over.
During 2021–22, consumer-rated clinical outcomes could be calculated for 8% to 35% of episodes, depending on consumer group and age band. Clinician-rated clinical outcomes could be calculated for 71% to 91% of episodes (Figure NOCC.5).
Caution should be applied in comparing outcomes using clinician-rated with consumer-rated measures because it cannot be assumed they are the same consumers.
Figure NOCC.5: Number of episodes to calculate consumer outcomes is very low for consumer-rated measures compared with clinician-rated measures
Interactive NOCC.5: Interactive doughnut chart showing the number of in-scope episodes in the National Outcomes and Casemix Collection (NOCC) with and without matched pairs of collection occasions, by age band and consumer group during one year, 2014–15 to 2021–22. The user can choose to display episodes for clinician-rated or consumer-rated measures. Overall, clinician-rated measures show a greater proportion of in-scope episodes with matched pair collection occasions compared with consumer-rated measures. Refer to NOCC Tables 15 to 20.

Notes:
- Clinical outcomes can only be calculated for episodes with a matched pair of collection occasions. For more information, refer to Data methods download.
- The per cent of in-scope episodes with and without matched pair collection occasions are represented by the coloured rings. The number of episodes with matched pair collection occasions is displayed in the centre of the ring for each age band and consumer group.
Consumer episodes can be classified into clinical outcomes of Improvement, No change, or Deterioration. These classifications rely on significance testing to identify change.
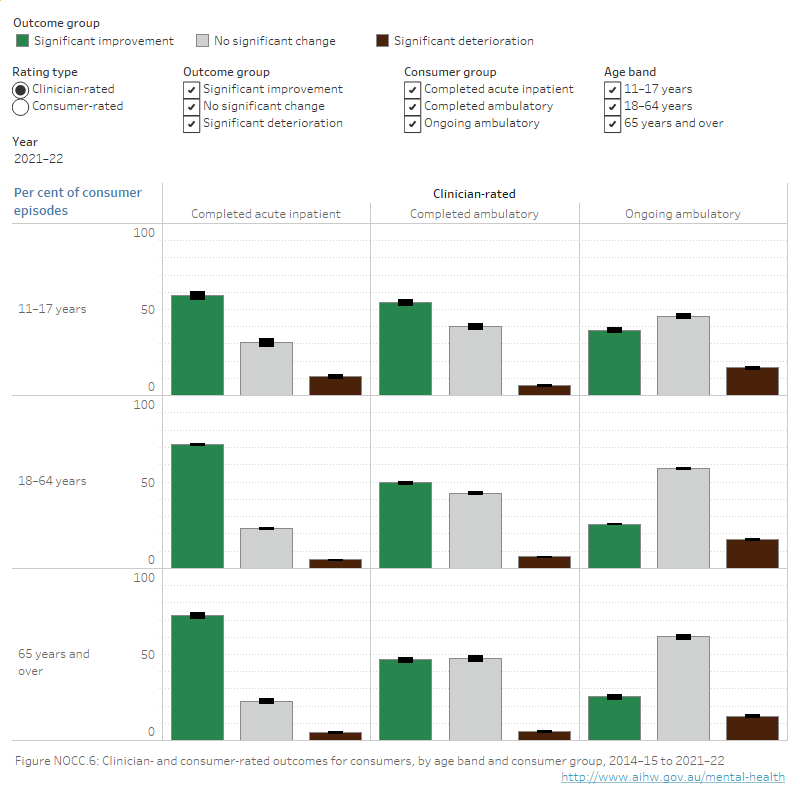
Clinical outcomes vary depending on consumer group and age band. There are some overall patterns in the data that apply across all age bands (Figure NOCC.6). During 2021–22:
- The highest proportions of Improvement compared to other clinical outcomes were for consumers who completed acute inpatient care. This held for both clinician- and consumer-rated measures using available data. People in this consumer group showed improvement for between 57% and 72% of episodes.
- People were more likely to show No change compared to other clinical outcomes if they were in ongoing ambulatory care, for both clinician- and consumer-rated measures. People in this consumer group showed no change for between 46% and 70% of episodes.
- Deterioration was the least common outcome compared with other clinical outcomes across all consumer groups. Consumers showed deterioration for between 2% and 17% of episodes.
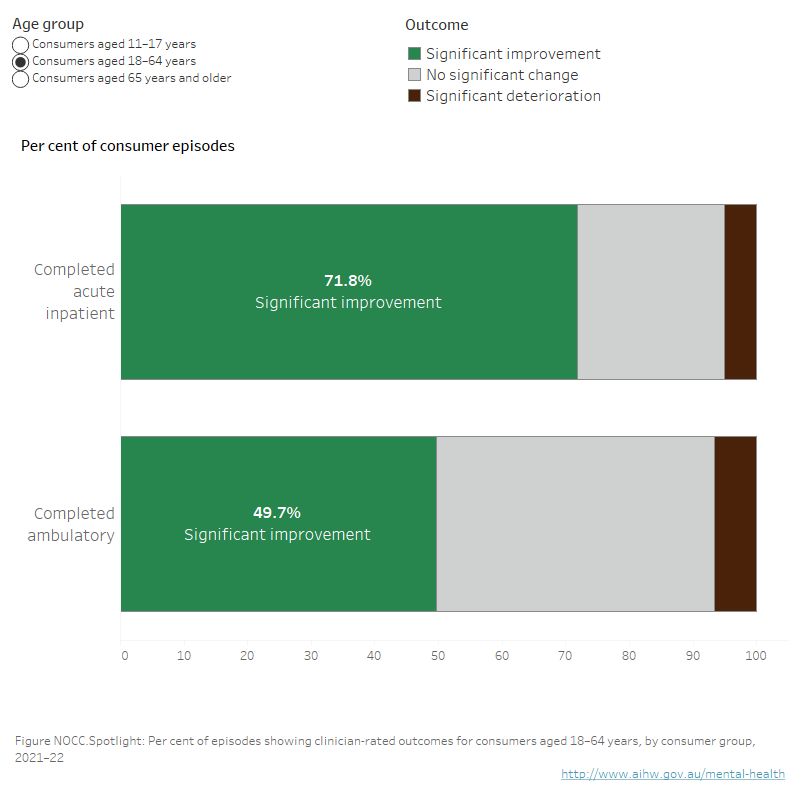
Figure NOCC.6: Clinician- and consumer-rated outcomes for consumers. The highest proportions of Improvement compared to other clinical outcomes were for consumers who completed acute inpatient care
Interactive NOCC.6: Interactive vertical bar chart with 95% confidence intervals showing consumer outcomes (significant improvement, no significant change, significant deterioration) calculated from the National Outcomes and Casemix Collection (NOCC), by age band and consumer group, during one year, 2014–15 to 2021–22. The user can choose to display outcomes for clinician-rated or consumer-rated measures. Refer to NOCC Tables 21 to 26.
Notes:
- Black bars representing 95% confidence intervals are displayed. For more information refer to Notes to interpret the data.
- Per cent of episodes that contain completed measures for two collection occasions that form a matched pair.
Children and adolescents (11–17 years)
Since 2014–15, on clinician-rated measures, more than half of episodes for consumers aged 11–17 show Improvement in completed acute inpatient care and completed ambulatory care. For consumers in this age band the biggest single category for those in ongoing ambulatory care has been No change (around 46% of episodes) (Figure NOCC.6).
In 2021–22, consumers showed Deterioration on clinician-rated measures in 16% of ongoing ambulatory episodes, 11% of completed acute inpatient episodes and 6% of completed ambulatory episodes.
Adults (18–64 years)
For both clinician-rated and consumer-rated measures, most episodes for consumers aged 18–64 have shown Improvement in completed acute inpatient and completed ambulatory care since 2014–15 (Figure NOCC.6).
During 2021–22, No change was the biggest single category for consumers in this age band in ongoing ambulatory care on both clinician-rated (58%) and consumer-rated (70%) measures.
On clinician-rated measures, consumers aged 18–64 showed Deterioration in 17% of ongoing ambulatory episodes, 7% of completed ambulatory episodes and 5% of completed acute inpatient episodes.
On consumer-rated measures, consumers in this age band showed Deterioration in 11% of ongoing ambulatory episodes, 2% of completed ambulatory episodes and 4% of completed acute inpatient episodes.
Older persons (65 years and older)
During 2021–22, on clinician-rated measures most episodes for consumers aged 65 and older in completed acute inpatient care showed Improvement (73% of episodes). No change was the biggest category in this age band for consumers in ambulatory care (58%) (Figure NOCC.6).
On clinician-rated measures, consumers showed Deterioration in 14% of ongoing ambulatory episodes, 5% of completed ambulatory episodes and 5% of completed acute inpatient episodes.
On consumer-rated measures, most episodes for consumers aged 65 and older in completed acute inpatient care showed Improvement (57% of episodes). For ongoing ambulatory care and completed ambulatory care most episodes (69% and 66% of episodes, respectively) showed No change.
On consumer-rated measures, consumers showed Deterioration in 11% of ongoing ambulatory episodes, 2% completed ambulatory episodes and 6% completed acute inpatient episodes.
Clinical outcomes is a Key Performance Indicator for Australian mental health services
Change in mental health consumers’ clinical outcomes is included in the Key Performance Indicators for Australian Public Mental Health Services. These indicators contribute to measuring the performance and progress of mental health services in Australia. The indicators are also reported on Mental Health Online Report. Refer to the data source section for more information.
Patient-reported measures in Australia
This report draws on data from the National Outcomes and Casemix Collection. The NOCC collects patient-reported perspectives of their mental health status during mental health care to report clinical outcomes as rated by consumers in all Australian states and territories.
The Your Experience of Service survey has been implemented in three Australian states to gather patient-reported experience of care from mental health service consumers. Survey respondents rate their experience of the service they received across 26 questions, including two questions on the patient’s perspective of outcomes of care. For more information visit Consumer perspectives of mental health care.
Australia is one of the countries reported by the international Organisation for Economic Cooperation and Development (OECD) to regularly collect and report patient-reported outcome measures (PROMs) and patient-reported experience measures (PREMs) in mental health settings (Bienassis et al. 2021).
International outcomes of mental health care
The OECD’s Healthcare Quality and Outcomes Indicators (HCQO) include indicators of mental health care, such as patient perspectives and outcomes of that care. This includes data from 40 countries, including Australia. Measures used as indicators include excess mortality of people with mental disorders and patient-reported measures of mental health care outcomes. To date, the use of mental health care PROMs is limited to a small number of countries and settings – and “there is a pressing need, both within and across countries, to consistently and effectively measure the effects and impact of care for patients who use mental health care services” (OECD 2022).
Patient-Reported Indicator Surveys (PaRIS)
PaRIS is OECD’s Patient-Reported Indicator Surveys initiative where 20 countries, including Australia, are working together on developing, standardising and implementing a new generation of indicators that measure the outcomes and experiences of health care, including mental health care.
The PaRIS survey aims to provide insights in consumer-rated outcomes and consumer-reported experiences across provider types and regions by asking about aspects including access to health care and psychological wellbeing.
The PaRIS pilot data collection on mental health includes 15 data sources from 12 countries, collected over the course of 2021. Initial findings of the PaRIS mental health pilot data indicate improvement following treatment on patient-reported outcomes for those receiving mental health care services in the settings which were able to submit data. Across sites that were able to submit data, there was an average improvement of over 2 points from admission to discharge on life satisfaction, and almost 2 point improvement on respondents saying that they felt the things they were doing in their life were worthwhile on a scale of 1 to 10 (OECD 2022).
Where can I find more information?
You may also be interested in:
- Consumer perspectives of mental health care
- Key Performance Indicators
- Involuntary treatment in mental health care
- Specialised mental health care facilities
More detailed data are available via the National Outcomes and Casemix Collection Web Decision Support Tool and Reports Portal.
Notes to interpret the data
A range of other mental health services are not included in the NOCC – for example, clinical measures may be collected to aid consumers’ recovery in private hospitals, private clinicians’ practices, non-government organisations, primary health care networks, and other services. For more information on outcomes of mental health care in private hospitals see the Australian Private Hospital Association Private Psychiatric Hospitals Data Reporting and Analysis Service (PPHDRAS).
In this section, measures of statistical uncertainty pertaining to estimates (95% confidence intervals) are shown in all data tables and represented in data visualisations by black bars. If the intervals for comparison groups do not overlap – that is, they do not include the same values in the range – the difference between groups can be generally inferred to be statistically significant.
More about confidence intervals
A confidence interval is a range of values that quantifies the statistical uncertainty in estimates that result from natural or random variation. For example, in the number of services provided and the number of persons using services over time. There are also non-random sources of uncertainty, such as incomplete reporting, that are not captured by confidence intervals.
Generally, confidence intervals describe how different an estimate could have been if the underlying conditions stayed the same but random fluctuations had led to a different set of data. Accordingly, it is recommended that confidence intervals are reported alongside a number estimate.
Confidence intervals are calculated with a stated probability (commonly 95%); this means we can be 95% confident that the confidence interval includes the true value if the assumptions made in the construction of the confidence interval hold. Larger numbers of observations yield more precise estimates with narrower confidence intervals. Confidence intervals can be used to perform tests of statistical significance. If the 95% confidence intervals do not overlap – that is, they do not include the same values in the range – the difference can be said to be statistically significant (note that differences can be significant in a subset of cases where the ranges do overlap).
In this section, 95% confidence intervals are shown in most figures and all tables.
Further information about confidence intervals, including calculation methods, statistical assumptions behind the calculation and sources of variability can be found in the Data and analysis methods resource.
Clinical measures are particular surveys or forms that are used to gather information about a person's clinical mental health status and functioning. These measures can be completed by clinicians about the consumer (known as clinician-rated), completed by the consumer (consumer-rated), and completed by families and carers about the consumer (carer-rated).
However, clinician-rated measures are completed at much higher proportions than consumer-rated measures and there are differences in the types of consumer-rated measures used in each state or territory. For example, in 2021–22, clinician-rated measures were collected at admission for between 87% and 94% of expected collection occasions while consumer-rated measures were collected between 25% and 59% of the time (numbers depend on age band and service setting). Data are available in Tables NOCC.5, NOCC.6, and NOCC.7.
For these reasons, the clinician-rated suite of Health of the Nation Outcome Scales (HoNOS) is used in this report to provide a national picture of the mental health-related problems faced by consumers at admission to a mental health service.
Continuous collection of information about consumers’ mental health can be used to report on consumers’ outcomes of care – that is, whether consumers of mental health services show improvement, no change, or deterioration from receiving mental health care.
Under the NOCC specifications, clinical and casemix measures may be completed at collection occasions in public specialised mental health services, including psychiatric inpatient (admitted), residential and ambulatory (non-admitted) settings. The three collection occasion types are Admission, Review, and Discharge. A person may have multiple collection occasions.
During 2021–22 there were around 490,400 collection occasions across all age bands and settings, an increase of 24% of collection occasions since 2014–15. Since 2014–15, around 3 in 4 of collection occasions are set in ambulatory service settings – accounting for 90% of collection occasions for people aged 11–17 years, 75% for people aged 18–64, and 84% for people aged 65 years and older in 2021–22.
Collection occasions in inpatient settings represent more than 1 in 5 collection occasions in total – this varies by age group. For people aged 11–17 years, 10% of collection occasions were set in an inpatient setting in 2021–22, compared to 23% for people aged 18–64, and 16% for people aged 65 years and older. Within inpatient settings, the majority of service programs (95%) provide acute care across all ages (Tables NOCC.3 and NOCC.4).
Since 2014–15, collection occasions in residential services account for no more than 2% in any age band (Table NOCC.3). This section reports data for ambulatory and acute inpatient service settings.
Clinician-rated measures are completed at much higher proportions than consumer-rated measures. This is the case for each type of collection occasion (admission, discharge and review) and across all age bands for both acute inpatient and ambulatory settings.
There are several factors in the completion of consumer-rated measures. The NOCC protocol requirements vary across settings and lengths of care. In addition, current NOCC data shows that consumer-rated measures are seldom used in services for older persons. Collection of SDQ measures in children and adolescent services is much higher than the collection of consumer-rated measures in adult and older persons services (NMHIDEAP 2013).
Mental health legal status is a major factor influencing consumer-rated completion rates. Consumer engagement is difficult for consumers under involuntary orders (NMHIDEAP 2013).
The same clinician-rated measures have been adopted by all states and territories implementing the NOCC. There is more variability for the consumer-rated measures, with states and territories adopting different measures.
For these reasons, the clinician-rated suite of Health of the Nation Outcome Scales (HoNOS) is used in this report to provide a national picture of the mental health-related problems faced by consumers at admission to a mental health service. This makes use of the most consistent and comparable data across states and territories.
More information can be found in the Data and analysis methods resource.
Information gathered at collection occasions can be organised into consumer groups, which pairs the episode type (completed, ongoing, closed) with the setting in which treatment is provided (acute inpatient, ambulatory). Clinical outcomes are calculated by consumer group and episode type.
More about consumer groups
The most frequent consumer groups are:
- Completed acute inpatient (96% of acute inpatient episodes) – episodes that started and finished within the reporting year with a duration longer than 3 days. Consumers are often very unwell at admission, but their symptoms can often be treated quite effectively and reasonably quickly. Many of the consumers in this group will be discharged to ambulatory services once their symptoms have begun to improve (Table NOCC.13).
- Completed ambulatory (33% of ambulatory episodes) – episodes that started and finished within the reporting year with a duration longer than 14 days. Consumers may be seen in ambulatory services only or in ambulatory services following an episode of acute inpatient care. The severity of symptoms at the beginning of an episode is generally better than for consumers in acute inpatient care.
- Ongoing ambulatory (49% of ambulatory episodes) – episodes of care that were still open at the end of the reporting year. Consumers may be affected by illnesses that are persistent or episodic in nature. Goals of care for these consumers may be to reduce symptoms, improve functioning or maintain their current state of wellness and prevent deterioration. Thus, for some consumers, no significant change may be a positive result that provides a basis for longer-term treatment.
Data reported in this section are sourced from the National Outcomes and Casemix Collection (NOCC) Database.
The NOCC is a nationally agreed data collection for the routine collection and reporting of consumer outcomes using clinical measures. Under the original National Mental Health Policy 1992, Australian governments committed to national monitoring of the effectiveness of public mental health services. The primary objective of the NOCC was to establish the routine use of outcome measures in all publicly funded or managed mental health services, where such measures contribute both to improved practice and service management (Burgess et al. 2015). The NOCC has been progressively implemented in state and territory public sector specialised mental health services from 2001 with all jurisdictions reporting by June 2005.
The NOCC collects information about a person's clinical mental health status and functioning during their episode of mental health care. Measures completed by clinicians about the consumer (known as clinician-rated) and measures completed by the consumer (consumer-rated) are used. These measures are completed at multiple collection occasions during an episode of care to monitor changes in consumers' clinical status and functioning. Ratings information is used to report on consumers’ outcomes of care.
The NOCC also gathers ‘casemix’ information, which is information about the mix of people who are receiving mental health services according to their clinical status and the nature of the care they are receiving. The casemix information collected in the NOCC supports the introduction of the first version of the Australian Mental Health Care Classification (AMHCC) (Independent Hospital Pricing Authority 2018). In this report, the reported casemix items are the consumer’s mental health legal status and diagnosis.
The collection of measures for the NOCC is guided by a set of rules on what measures to collect and when to collect them. More information is in the Data and analysis methods resource and more detailed information is in the technical specifications.
Data Quality Statements are published annually on METEOR. Statements provide information on the institutional environment, timeliness, accessibility, interpretability, relevance, accuracy and coherence. Refer to the Data Quality Statement.
National indicator set: Change in consumers’ clinical outcomes
The Key Performance Indicators for Australian Public Mental Health Services (KPIs) were developed for the purpose of improving public mental health services. KPI 01 Change in mental health consumers’ clinical outcomes draws on data from the NOCC for reporting. These indicators contribute to measuring the performance and progress of mental health services in Australia.
The original KPI set was released in 2005, with the aim to measure and improve the performance of public mental health services. The indicators have been revised over time through the former National Mental Health Performance Subcommittee (NMHPSC) of the former Mental Health Information Strategy Standing Committee (MHISSC), to drive and incorporate data improvements, jurisdictional implementation and results of nation-wide projects (NMHPSC 2013).
Change in mental health consumers’ clinical outcomes was added to the national KPI set in 2011 (NMHPSC 2013).
The Key Performance Indicators are published on Mental health Online Report (MHOR). Due to differences in methodology there is variation in the NOCC data that are reported for the KPIs, this section, and other reporting tools.
Other reporting tools
Other NOCC public reporting products focus on the clinical utility of the collection, through the publication of ‘normative’ reference data for the clinical measures that assist clinicians and other users to better understand the outcomes and variability in the population under care.
A Web Decision Support Tool allows users to compare an individual consumer’s scores at a single point in time, or change in scores over time, against normative data from ‘like’ consumers around Australia. In addition, scores on clinician- and consumer-rated measures can be displayed side-by-side which facilitates engagement with the consumer/family around different perspectives on mental health status.
A Reports Portal allows users to create tailored reports that provide different statistical summaries of the NOCC data, for example the change in scores on various measures across the course of given episodes. More granular reports can be created by selecting from a range of variables, for example age, measure (including item level), service setting, collection occasion, collection reason, jurisdiction, diagnosis, sex and legal status.
In the Web Decision Support Tool and the Reports Portal, NOCC data are reported at national and state/territory levels.
Key concepts
Bienassis K, Kristensen S, Hewlett E, Roe D, Mainz J and Klazinga N (2021) 'Patient-reported indicators in mental health care: towards international standards among members of the OECD', International Journal for Quality in Health Care, 34(S1): ii7-ii2, doi:10.1093/intqhc/mzab020.
Burgess P, Pirkis J and Coombs T (2015) 'Routine outcome measurement in Australia', International Review of Psychiatry, 27(4):264-75.
CIHI (Canadian Institute for Health Information) (2021) Outcomes, CIHI website, accessed 18 May 2021.
Cohen J (1988) Statistical Power Analysis for the Behavioral Sciences, Hillsdale, New Jersey: Lawrence Erlbaum Associates Inc.
Independent Hospital Pricing Authority (2018) Australian Mental Health Care Classification v1.0 User Manual, Sydney: IHPA.
NMHIDEAP (National Mental Health Information Development Expert Advisory Panel) (2013) Mental Health National Outcomes and Casemix Collection: NOCC Strategic Directions 2014 – 2024, Commonwealth of Australia, Canberra, AMHOCN website, accessed 13 July 2023.
NMHPSC (National Mental Health Performance Subcommittee) (2013) Key Performance Indicators for Australian Public Mental Health Services, 3rd edn, NMHPSC, Australian Health Ministers Advisory Council’s Mental Health Drug and Alcohol Principal Committee (MHDAPC).
OECD (Organization for Economic Co-operation and Development) (2022) Establishing standards for assessing patient reported outcomes and experiences of mental health care in OECD countries: Technical report of the PaRIS mental health working group pilot data collection, OECD website, accessed 13 July 2023.
Data coverage includes the time period 2014–15 to 2021–22 for collection occasions and episodes and 2014–15 to 2020–21 for coverage of consumers. This section was last updated in October 2023.