Clients

Who uses alcohol and other drug treatment services?

Around 131,500 people received publicly funded treatment or support for alcohol and other drug use.

Alcohol and other drug (AOD) treatment agencies across Australia provide a range of services and support to people receiving treatment for their own drug use, as well as for their families and friends.

Profile of clients

In 2022–23, among people receiving alcohol and other drug treatment:

  • Publicly funded AOD treatment services provided treatment to about 131,500 clients across Australia.
  • 3 in 5 people (60%) who received treatment for their own or someone else’s alcohol or drug use were male.
  • Of the 94% of clients who received treatment for their own alcohol or drug use, half were aged 20–39 (51%) and around 3 in 5 (61%) were male.
  • Of the 5.9% of clients who received support for someone else’s drug use, nearly half were aged 30–49 (46%) and nearly half were female (47%).
  • Less than one percent (0.8%) of all clients reported a sex of ‘Another term’, which includes people who reported sex as indeterminate, intersex or non-binary. The 2018–19 collection included ‘Other’ as a value for the client’s sex for the first time, this category was updated to ‘Another term’ for the 2022–23 collection (Figure AODTS CLIENTS.1).

Figure AODTS CLIENTS.1: Client demographics (age group, sex, Indigenous status), by state and territory, 2013–14 to 2022–23

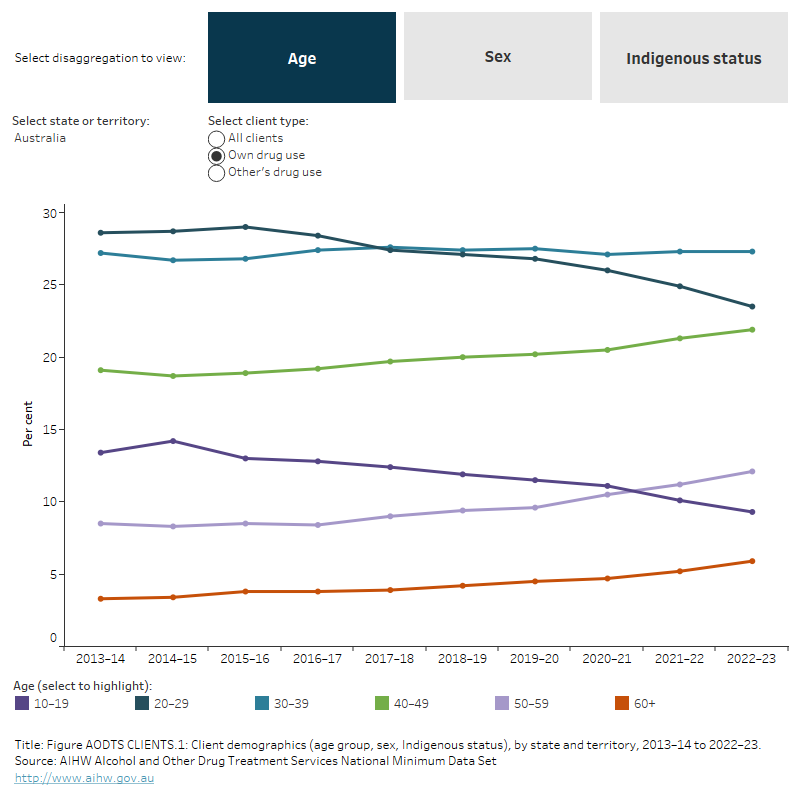
The line graph shows proportions of clients receiving treatment from alcohol and drug treatment services by age group and client type. Nationally, the distribution of clients by age group has remained consistent from 2013–14 to 2022–23. In 2022–23, 9.3% of clients receiving treatment for their own drug use were aged 10–19, 23.5% were aged 20–29, 27.3% were aged 30–39, 21.9% were aged 40–49, 12.1% were aged 50–59 and 5.9% were aged over 60.

The first horizontal stacked bar graph shows proportions of clients receiving treatment from alcohol and drug treatment services by sex and client type. In 2022–23, 60.8% of clients receiving treatment for their own drug use were male, 33.8% were female and 5.4% were another sex or not stated. Among clients receiving treatment for other’s drug use, 40.2% were male, 46.7% were female and 13.1% were another sex or not stated. Among all clients, 59.6% of clients were male, 34.6% of clients were female and 5.8% were another sex or not stated. 

The second horizontal stacked bar graph shows proportions of clients receiving treatment from alcohol and drug treatment services by Indigenous status and client type. In 2022–23, 18.1% of clients receiving treatment for their own drug use were First Nations people, 79.3% were non-Indigenous and 2.7% were not stated. Among clients receiving treatment for other’s drug use, 11.4% were First Nations people, 83.9% were non-Indigenous and 4.7% were not stated. Among all clients, 17.7% of clients were First Nations people, 79.5% of clients were non-Indigenous and 2.8% were not stated. 

Notes:

  1. National, state and territory data are based on client records with a valid and distinct Statistical Linkage Key (SLK-581). Client data exist from the 2013–14 collection onwards.
  2. The client data used in these visualisations are not imputed (not adjusted for missing Statistical Linkage Keys). Therefore, these numbers may differ from what has been previously published.
  3. Not stated for age group excluded. 
  4. Data are subject to minor revisions over time.
  5. Components of tables may not sum to totals due to rounding.
  6. For data item ‘Sex’, ‘Not stated’ includes ‘Another term’.

Aboriginal and Torres Strait Islander (First Nations) people

The National Agreement on Closing the Gap noted that funding for Aboriginal and Torres Strait Islander (First Nations) Alcohol and Other Drugs (AOD) services and support will increase by up to $66 million to 2024–25, in addition to current funding. First Nations’ AOD Treatment Services funded under the Indigenous Advancement Strategy (IAS) currently assists more than 65 providers to deliver AOD activities (Department of Prime Minister and Cabinet 2024). The Commonwealth also provides AOD treatment services and prevention, research and communication activities through the Drug and Alcohol Program (DAP) and funding to Primary Health Networks (PHNs), with nearly 30% of PHN funding allocated for First Nations specific treatment services (National Indigenous Australians Agency 2022).

In 2022–23, First Nations people accounted for 18% (23,258) of people aged 10 and over receiving treatment or support for their own or someone else’s alcohol or other drug use (Figure AODTS CLIENTS.1):

  • Over 1 in 6 First Nations clients (22,371 or 18%) received treatment for their own alcohol or drug use.
  • Over 1 in 10 (887 or 11%) First Nations clients received treatment for someone else’s alcohol or drug use.
  • First Nations clients were nearly 6 times as likely to receive treatment for alcohol or drug use as non-Indigenous Australians after adjusting for differences in age-structure (3,370 per 100,000 population compared with 496) (age standardised rate ratio for clients aged 10 and over).

The Australian Government funds primary healthcare services and substance use services specifically for First Nations people. These services may be in scope for the AODTS NMDS, but the majority of the services currently do not report to the NMDS. Substance use services previously reported via the First Nations Online Services Report (OSR) data collection up to 2017–18 (AIHW 2024). The substance use services program was transferred to the Indigenous Affairs Group within the Department of Prime Minister and Cabinet in September 2013 and then to the National Indigenous Australians Agency in July 2019 (Australian National Audit Office 2017, National Indigenous Australians Agency 2024). Since the cessation of substance use services data being collected by the OSR, the number of substance use services for First Nations people in-scope and reporting to the AODTS NMDS has gradually increased.

Client trends

The number of people aged 10 and over receiving alcohol and other drug treatment rose by 15% from 2013–14 to 2022–23.

The number of people who received treatment from publicly funded AOD treatment agencies increased by 15% between 2013–14 (114,436 or 564 per 100,000 people) and 2022–23 (131,516 or 568 per 100,000) (Figure AODTS CLIENTS.2). Between 2020–21 and 2021–22, the number of clients decreased by 6% (from 139,271 to 130,525) before slightly increasing by 0.8% in 2022–23 (131,516).

Figure AODTS CLIENTS.2: Number of clients and rates per 100,000, by state and territory, 2013–14 to 2022–23

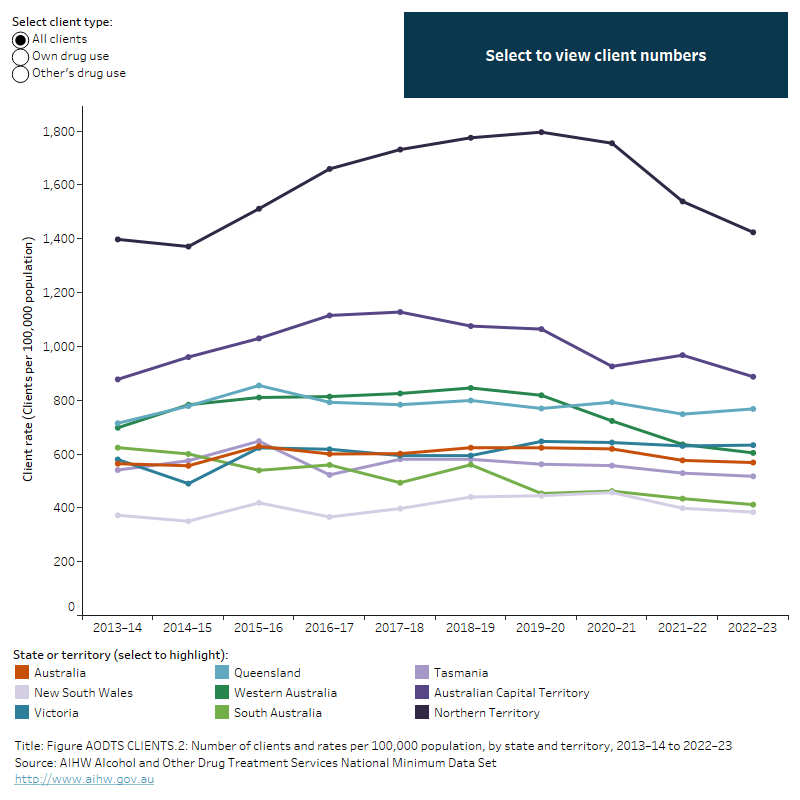
The line chart shows client rates per 100,000 population by state and territory and client type. 

Client rates for alcohol and/or drug use in Australia fluctuated from 564 clients per 100,000 population in 2013–14 to 568 clients per 100,000 population in 2022–23. Rates in each state in 2022–23 were: 384 clients per 100,000 population in New South Wales; 633 clients per 100,000 population in Victoria; 768 clients per 100,000 population in Queensland; 604 clients per 100,000 population in Western Australia; 412 clients per 100,000 population in South Australia; 517 clients per 100,000 population in Tasmania; 887 clients per 100,000 population in the Australian Capital Territory; and 1,424 clients per 100,000 population in the Northern Territory.

A filter allows the user to view by rate of clients and number of clients. 

The second line chart shows client numbers for alcohol and/or drug use in Australia. There were 131,516 clients in 2022–23, an increase from 114,436 clients in 2013–14. Across the period 2013–14 to 2022–23, the number of clients was highest in the Victoria (37,417 clients in 2022–23) and lowest in Tasmania (2,642 clients in 2022–23).

Notes:

  1. National, state and territory data are based on client records with a valid Statistical Linkage Key (SLK-581). Client data exist from the 2013–14 collection onwards.
  2. Client rates and numbers are calculated based on overlapping unit record data sorted by client type within each state/ territory. As clients can receive treatment in multiple states/territories and can receive treatment for different reasons (own use or another person's use) within the same collection period, the number of clients for Australia is less than the summed number of clients for each state/ territory. Therefore, the rates and numbers by each state/ territory may differ from those reported elsewhere as they are calculated from the summed number of clients for each client type in each state/ territory.
  3. The client data used in these visualisations is not imputed (not adjusted for missing Statistical Linkage Keys). Therefore, these numbers may differ from what has been previously published.
  4. Client trend rates are crude rates based on the Australian estimated resident population as at 31 December of the reference year. Rates for previous years may differ to previously reported due to updated estimated resident populations.
  5. The COVID-19 pandemic and the resulting Australian Government closure of the international border from 20 March 2020, caused significant disruptions to the usual Australian population trends. This report uses Australian Estimated Resident Population (ERP) estimates that reflect these disruptions. In the year July 2020 to June 2021, the overall population growth was much smaller than the years prior and in particular, there was a relatively large decline in the population of Victoria. ABS reporting indicates these were primarily due to net-negative international migration (National, state and territory population, June 2021 | Australian Bureau of Statistics (abs.gov.au)). Please be aware that this change in the usual population trends may complicate interpretation of statistics calculated from these ERPs. For example, rates and proportions may be greater than in previous years due to decreases in the denominator (population size) of some sub-populations.
  6. In 2019–20, the implementation of the Victorian Alcohol and Drug Collection (VADC) system in Victoria allowed for more accurate reporting of client's receiving treatment for another person's drug and/or alcohol use.
  7. Data are subject to minor revisions over time.
  8. Components of tables may not sum to totals due to rounding.