Clients

People may receive treatment for their own or someone else’s alcohol or drug use (see Key terminology and glossary). Characteristics of all clients are described below, including clients’ principal drugs of concern by age group and clients receiving treatment in multiple collection years. 

The Alcohol and Other Drug Treatment Services (AODTS) collection captures information on treatment services accessed by clients. It does not measure the underlying need for treatment or level of problematic alcohol or drug use in the community. Changes in client numbers may be due to clients’ access to treatment, treatment availability and/or funding available for alcohol and other drug treatment services.

Key findings

In 2021–22:

  • around 131,000 people aged 10 and over received treatment for their own or someone else’s alcohol and/or drug use from publicly funded AOD treatment services. This equates to 576 clients per 100,000 people
  • around 228,500 treatment episodes were provided to clients
  • an average of 1.7 treatment episodes were provided to people receiving treatment for their own alcohol or drug use
  • 6 in 10 people were male (60%), and over half (52%) were aged 20–39
  • 1 in 6 (18%) people aged 10 and over identified as Aboriginal and/or Torres Strait Islander
  • of the clients receiving treatment in 2021–22, 47% had previously received treatment at some point since 2017–18.

In the 5 years to 2021–22: 

  • around 469,000 Australians received treatment for alcohol or drug use, some having received treatment across multiple years
  • there has been a 14% increase in client numbers from 2013–14, from around 114,400 to 131,000. Adjusting for population growth, this equates to an increase in the rate of service use from 564 clients per 100,000 population to 576 over this period. 

Characteristics of clients

The number of people treated by publicly funded alcohol and other drug treatment agencies increased from 114,436 in 2013–14 to 130,525 in 2021–22 (14% increase). When taking population growth into consideration, the rate of people accessing services has also increased from 564 clients per 100,000 population in 2013–14 to 576 clients per 100,000 population in 2021–22 (Figure AODTS CLIENTS 1, Table SCR.21). Of the clients receiving treatment in 2021–22, 47% had previously received treatment at some point since 2017–18 (Table SCR.28).

In 2021–22, 124,165 people received treatment for their own alcohol or drug use and 12,536 sought treatment in relation to someone else’s alcohol or drug use. Around 1 in 20 (4.7% or 6,176) clients sought treatment for their own as well as someone else’s alcohol or drug use in 2021–22 (Table SCR.27).

Figure CLIENTS 1: AODTS clients and treatment episodes, by state and territory, 2013–14 to 2021–22

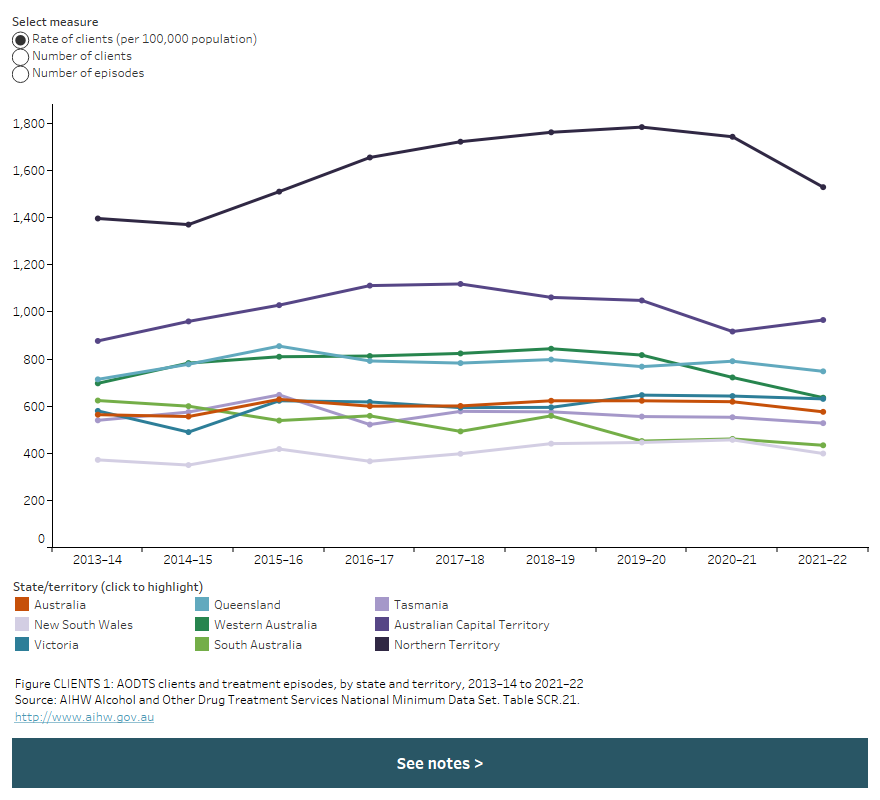
The line chart shows that there were 576 clients per 100,000 population in Australia in 2021–22, decreasing from 619 clients per 100,000 population in 2021-22. Across the period 2013–14 to 2021–22, the rate of clients was highest in the Northern Territory (1,530 per 100,000 in 2021–22) and lowest in New South Wales (399 per 100,000 in 2021–22). A filter allows the user to view by rate of clients, number of clients or number of treatment episodes.

Client profile

In 2021–22:

  • most people (93% or 121,700 clients) received treatment for their own alcohol or drug use; these clients were more likely to be male (62%)
  • in contrast, of the 6.8% (or 8,800 clients) people who received treatment for someone else’s alcohol or drug use, over 2 in 5 were female (45% or 4,000 clients) (15% or 1,400 reported not stated for sex) (Tables SC.1–2)
  • the rate of all clients receiving AOD services was highest for those that lived in Very remote areas (1,600 per 100,000 people) and lowest for those in Major cities (484 per 100,000; Table SCR.29)
  • almost 4 in 5 (79% or 103,200 clients) people received treatment at a single agency, 14% attended 2 agencies, and 6.7% of clients received treatment at 3 or more agencies (Table SCR.23).

See Key terminology and glossary for further information on how clients are counted in this report.

Age and sex

Clients who received treatment for their own alcohol or drug use tended to be younger than those who received treatment for someone else’s alcohol or drug use.

In 2021–22, client characteristics revealed:

  • the majority of all clients were male (60% or 78,700 clients) and over half (52% or 67,600 clients) were aged 20–39
  • just over 3 in 5 (62% or 75,900 clients) of people receiving treatment for their own alcohol or drug use were aged under 40, compared with over half (54% or 4,700 clients) of those who sought treatment for someone else’s alcohol or drug use
    • of the 75,900 people aged under 40 who received treatment for their own alcohol or drug use, 1 in 10 (10% or 12,300 clients) were 10–19 years of age
  • people aged 60 and over accounted for 5.2% (or 6,300) of clients who received treatment for their own alcohol or drug use, compared with 10% (or 900) of clients who sought treatment for someone else’s alcohol or drug use (Figure CLIENTS 2, Table SC.3).

Figure CLIENTS 2: Proportion of clients by client type, sex, and age group, 2013–14 to 2021–22

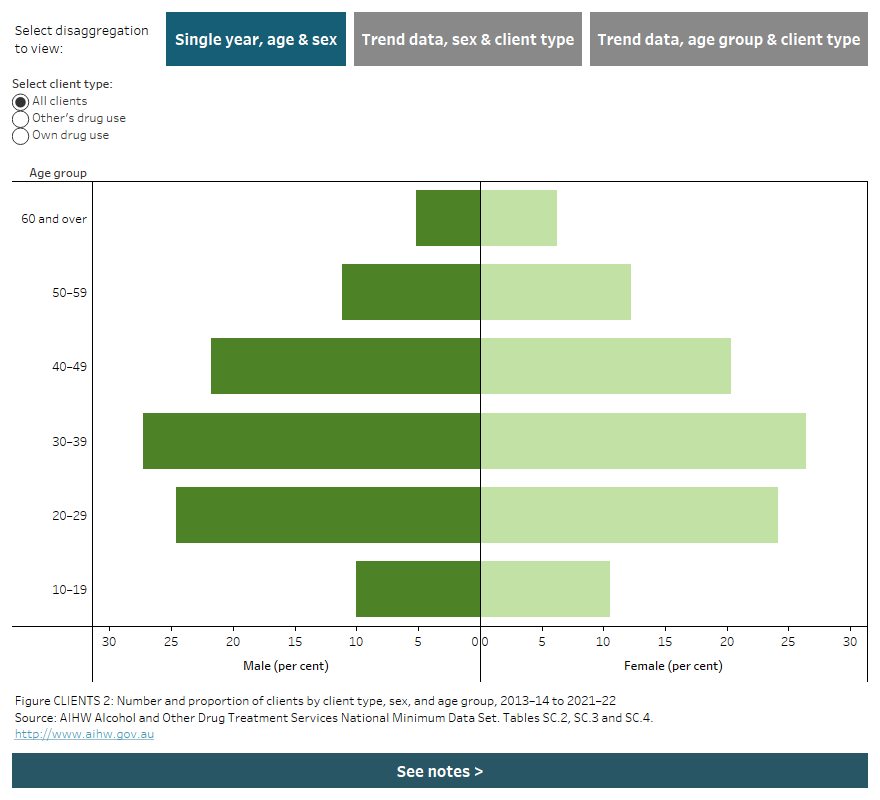
The butterfly bar chart shows that, among all clients, the most common age group for both male and female clients in 2021–22 was 30–39 (27.3% of males and 26.5% of females), followed by 20–29 (24.6% of males and 24.2% of females). A filter allows the user to view data for all clients, clients seeking treatment for their own drug use, or clients seeking treatment for someone else’s drug use. Buttons allow the user to navigate to bar charts presenting trend data disaggregated by sex, age group and client type.


Client service use over multiple years

Nationally since 2017–18, 468,996 people have received AOD treatment, some in more than one year (Figure CLIENTS 3, Table SCR.28).

Over the 5 years to 2021–22:

  • the majority received treatment in a single year (71%):
    • 69,788 (15%) of people received treatment for the first time in 2021–22
    • a further 261,822 (56%) of people received treatment in only 1 of the 4 collection periods (excluding 2021–22).
  • 3 in 10 (29%) of people received treatment in more than one year.

Figure CLIENTS 3: Client service use over multiple years, 2017–18 to 2021–22

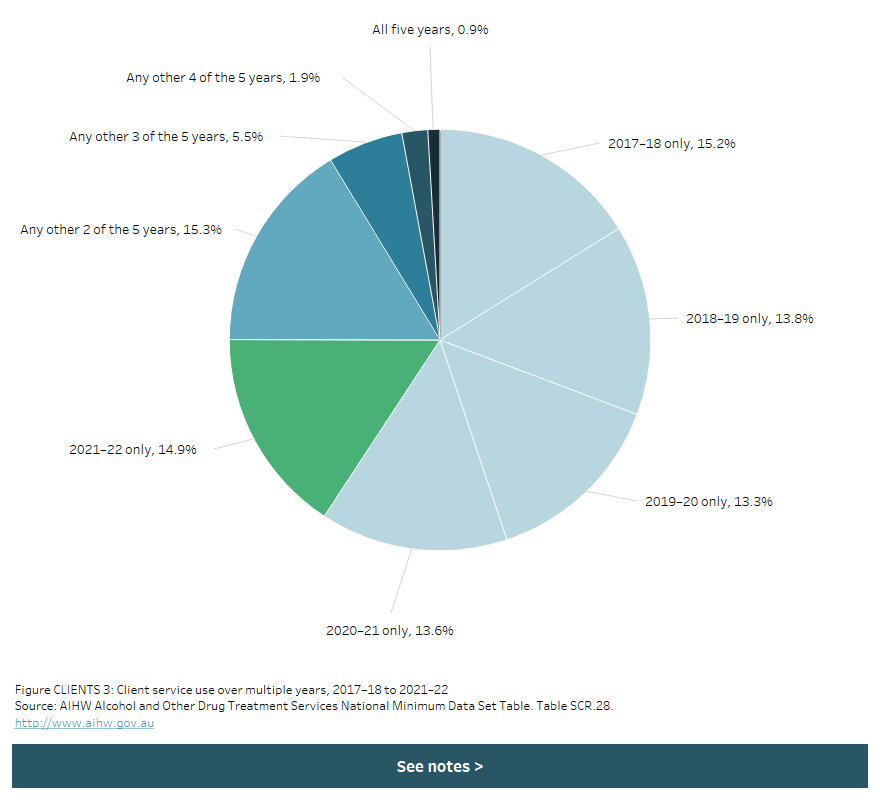
The pie chart shows the proportion of clients who received treatment in a single year only, 2 of the 5 years, 3 of the 5 years, 4 of the 5 years or all 5 years between 2017–18 and 2021–22. Most clients received treatment in a single year only (14.9% for 2021–22), 15.3% received treatment in 2 years, 5.5% in 3 years, 1.9% in 4 years and 0.9% received treatment in all 5 years.


Clients and drugs of concern

AOD treatment services provide treatment for the drug that is of most concern to the client, which is referred to as their principal drug of concern.

Different age groups sought treatment for different principal drugs of concern. For people who received treatment for their own alcohol or drug use in 2021–22:

  • Alcohol was the most common principal drug of concern in the older age groups: just under two-thirds of people aged 50–59 (64%) and over three-quarters of people aged 60 and over (77%) received treatment for alcohol as a principal drug of concern
  • Amphetamines were the most common principal drug of concern for those aged 20–29 and 30–39 (25% and 33%, respectively).
  • Cannabis was the most common principal drug of concern in young clients: 3 in 5 people aged 10–19 (61%) (Figure CLIENTS 4, Table SC.13).

Figure CLIENTS 4: Clients who received treatment for their own drug use, by age group and principal drug of concern, 2013–14 to 2021–22 

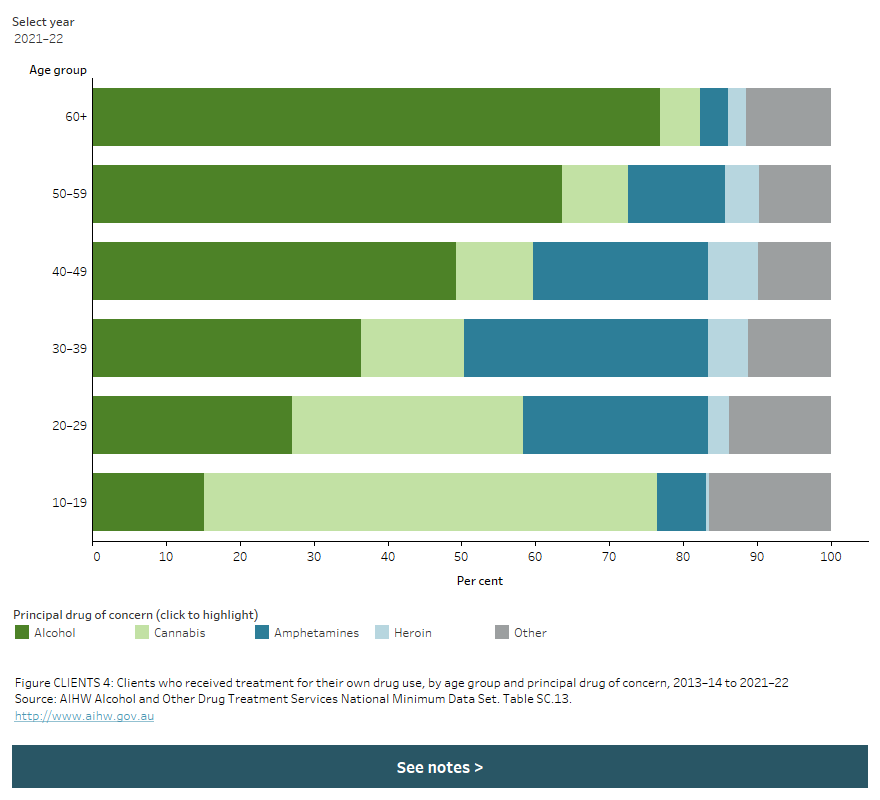
The stacked horizontal bar chart shows that the most common principal drug of concern (PDOC) differed with age in 2021–22. Cannabis was the most common PDOC for clients aged 10–19 (61.4% of clients) or 20–29 (31.3%). Amphetamines was the most common PDOC for clients aged 30–39 (32.9%), and alcohol was the most common principal drug of concern among clients aged 40–49 (49.3% of clients), 50–59 (63.6%) or 60+ (76.8%). A filter allows the user to view different years of data.

The age and sex profiles of the clients varied by principal drug of concern. For people who received treatment for their own alcohol or drug use in 2021–22:

  • where heroin was the principal drug of concern, people aged over 30 (83% of clients) were the most likely to receive treatment. Among these clients, 35% were aged 30‍–‍39 and 33% were aged 40–49 (Table SC.13)
  • over half (56%) of all people receiving treatment for codeine as the principal drug of concern were female
  • males were nearly 6 times more likely to receive treatment for cocaine as a principal drug of concern than females (83% of episodes for males; 14% for females) (Table SC.12)
  • 3 in 4 (75%) clients receiving treatment for volatile solvents as a principal drug of concern were Aboriginal and/or Torres Strait Islander (Table SC.14).

Usual accommodation type for client

The collection of information about a person’s usual type of accommodation where they lived prior to the start of their AOD treatment enables AOD services to identify people who may be vulnerable, such as those from custodial settings or people at risk of homelessness. This information may help identify people living in a public place or experiencing homelessness, supporting the ‘no exit to homelessness’ policy where agencies can only discharge a client to safe, stable housing (Department of Social Services 2020).

Usual accommodation type for the client prior to treatment is reported for selected jurisdictions: New South Wales, Queensland, Western Australia, South Australia, Australian Capital Territory and the Northern Territory. As data quality improves additional jurisdictional data will be reported. The following analysis includes 60% of all treatment episodes (137,338) (Figure CLIENTS 5, Table OV.13).

In 2021–22, treatment episodes reporting the usual accommodation type for AOD clients from selected states and territories revealed in all selected jurisdictions:

  • the most common accommodation prior to the start of treatment was independent residential accommodation (e.g., private residence, boarding house, private hotel or informal housing). Independent residential accommodation ranged from 51% in the Northern Territory to 89% in Western Australia
  • the Northern Territory reported the highest proportion of episodes with usual accommodation types as custodial (prison/remand centre/youth training centre) (18%) and supported independent living (16%)
  • South Australia reported the highest proportion of episodes with usual accommodation types as none/homeless/public place (9.9%) (Figure CLIENTS 5; Table OV.13).

Figure CLIENTS 5: Treatment episodes by client’s accommodation type prior to treatment service, selected states and territories, 2017–18 to 2020–21

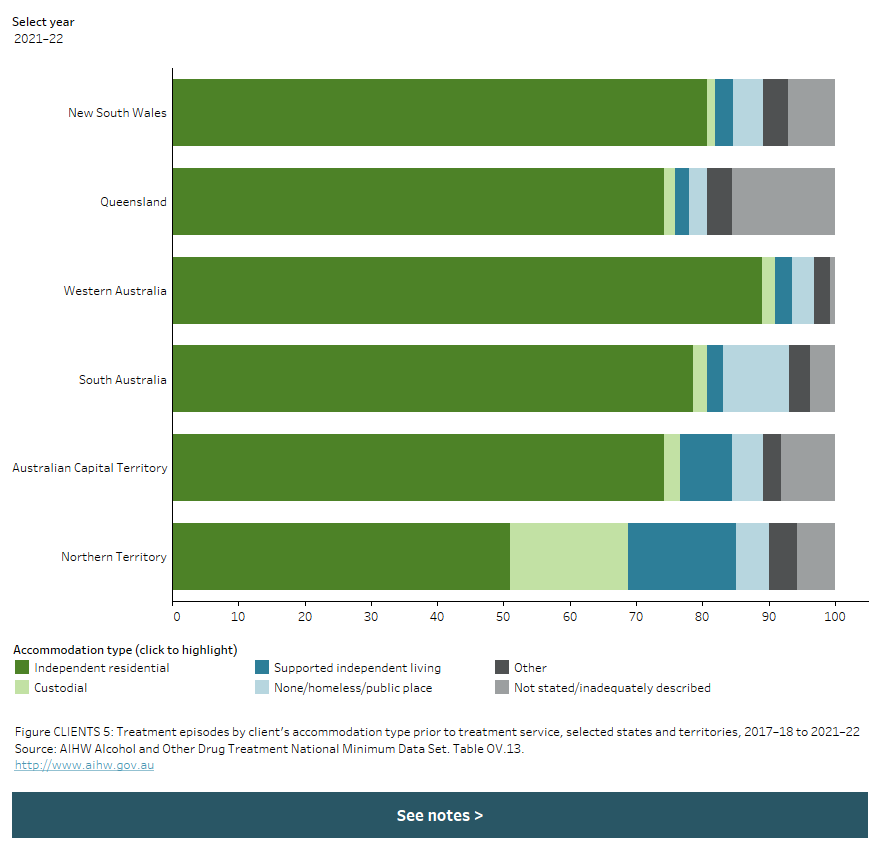
The stacked horizontal bar chart shows client accommodation type prior to treatment service for New South Wales, Queensland, Western Australia, South Australia and the Northern Territory in 2021–22. Independent residential accommodation was the most common accommodation type prior to treatment service across all included states/territories, ranging from 51.0% of clients in the Northern Territory to 89.0% in Western Australia. A filter allows the user to view different years of data.