New South Wales

In 2021–22, 475 publicly funded alcohol and other drug treatment agencies in New South Wales provided 44,777 treatment episodes to 28,364 clients (tables ST NSW.1, Agcy.1, SCR.21).

New South Wales reported:

  • the number of treatment episodes decreased by 14% between 2020–21 and 2021–22 (51,800 and 44,800 episodes, respectively), although over the 10 years since 2012–13 there has been a 6% increase in treatment episodes (35,300 episodes) (Table ST NSW.2)
  • more clients are using AOD services in 2021–22 than 2013–14, after adjusting for population growth (399 clients per 100,000 population compared with 372 per 100,000, respectively)
  • client numbers have increased from 24,200 in 2013–14 to 28,400 in 2021–22 (Table SCR.21).

The visualisation shows that 51,451 closed treatment episodes were provided to an estimated 31,549 clients in New South Wales in 2019–20. This equates to a rate of 723 episodes and 443 clients per 100,000 population, which is lower than the national rate (1,064 episodes and 624 clients per 100,000 population).

In 2021–22, most clients in New South Wales attended 1 agency (78% of clients) (Table SCR.23). Clients received an average of 1.6 treatment episodes, similar to the national average (1.8 episodes) (Table SCR.21).


Client demographics

In 2021–22:

  • nearly all (98%) clients in New South Wales received treatment for their own alcohol or drug use, of which almost 2 in 3 people were male (64%) (Figure NSW 1)
  • females were more likely to receive treatment for someone else’s drug use than males (56% of female clients compared with 43% of male clients)
  • Over half (51%) of all clients were aged 20–39 years
  • 1 in 5 (20%) of all clients identified as Indigenous Australians, consistent with the national proportion (18%)
  • the majority (87%) of all people were born in Australia and nearly all (97%) reported English as their preferred language (tables SC.4, SC NSW.1–3, SC NSW.21–22).

The visualisation includes a series of horizontal bar graphs showing that, in 2019–20, nearly all (98%) clients in New South Wales received treatment for their own drug use. Of these clients, around two-thirds (66%) were male, 52% were aged 20–39, and 18% were Indigenous Australians. Nearly all clients (97%) listed English as their preferred language and most (87%) were born in Australia.

Patterns of service use

Over the period 2017–18 to 2021–22, 104,500 clients received treatment in New South Wales (Table SCR.28). Of these clients, the majority received treatment in a single year (70% or 73,500):

  • 15,100 (14%) received treatment for the first time in 2021–22
  • a further 58,400 (56%) received treatment in only one of the five collection periods (excluding 2021–22).

Drugs of concern

In 2021–22, among clients in New South Wales receiving treatment for their own alcohol or drug use:

  • alcohol was the most common principal drug of concern (43% or 19,100 episodes)
  • amphetamines as a principal drug of concern accounted for over 1 in 5 episodes (22% or 9,900), followed by cannabis (16% or 7,200) (Figure NSW 2, Table ST NSW.6).

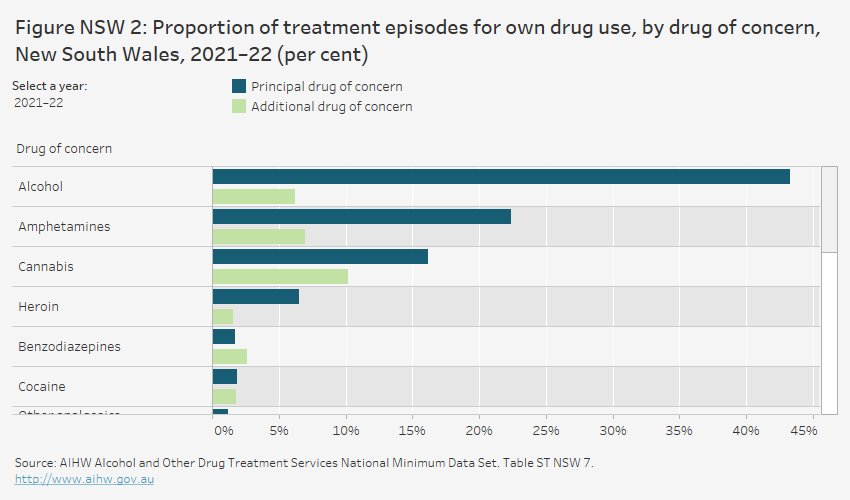
The grouped horizontal bar chart shows that, in 2020–21, alcohol was the most common principal drug of concern in treatment episodes provided to clients in New South Wales for their own drug use (40.6%). This was followed by amphetamines (22.5%), cannabis (16.3%), and heroin (6.9%). Nicotine and cannabis were the most common additional drugs of concern (10% and 9.9% of episodes, respectively), followed by amphetamines (6.9%) and alcohol (6.1%).

In 2021–22, for clients receiving treatment for their own use of amphetamines:

  • methamphetamine was reported as a principal drug of concern in 93% of treatment episodes (Table Drg.4)
  • in half (50%) of the treatment episodes where methamphetamine was the principal drug of concern, smoking was the most common method of use, followed by injecting (39%) (Figures NSW 3a, 3b).

Some jurisdictions are working with service providers to encourage more specific reporting of amphetamine use (i.e. to reduce the use of ‘amphetamines not further defined’ code where possible).

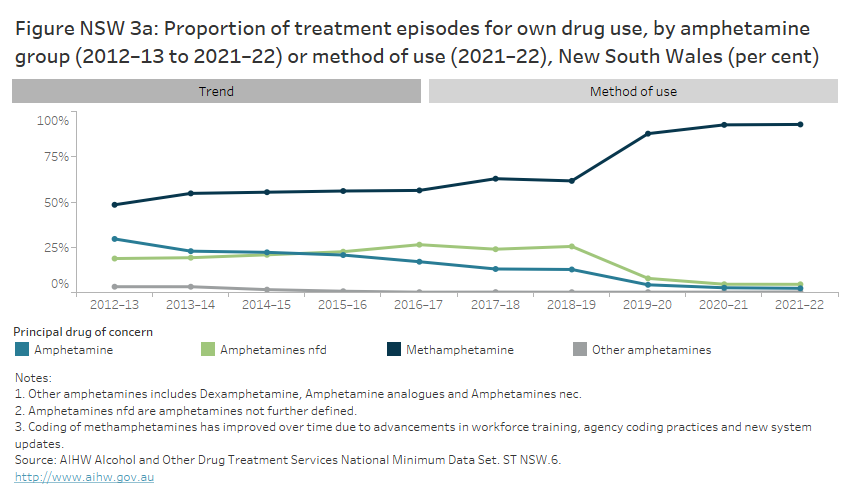
The line graph shows that, between 2011–12 and 2020–21, methamphetamine has remained the most common drug of concern among amphetamine-related treatment episodes for clients’ own drug use. The proportion of methamphetamine-related episodes increased from 45.1% of amphetamine-related episodes in 2011–12 to 92.6% in 2020–21.

The stacked horizontal bar chart shows the method of use for treatment episodes related to clients’ own use of methamphetamine, amphetamine, amphetamines not further defined, and other amphetamines in New South Wales in 2020–21. Smoking was the most common method of use across all amphetamine codes (ranging from 37.5% to 52.6% of episodes).

Clients can nominate up to 5 additional drugs of concern; these drugs are not necessarily the subject of any treatment within the episode (see technical notes).

In 2021–22, when the client reported additional drugs of concern, nicotine and cannabis were the most common additional drugs of concern (11% and 10% of episodes, respectively), followed by amphetamines (7.0%) and alcohol (6.2%) (Table ST NSW.7).

Over the period 2012–13 to 2021–22 New South Wales was consistent with national trends:

  • alcohol remained the most common drug of concern, although there was variation in treatment episode numbers during this time, fluctuating from 14,700 to 19,100 episodes over this period; the proportion of alcohol treatment episodes relative to all other drugs of concern, declined from 43% in 2012–13 to 37% in 2016–17, rising to 43% again in 2021–22 (Figure NSW 2, Table ST NSW.6)
  • amphetamines were the second most common principal drug of concern in 2021–22 and have increased since 2013–14 (from 14% or 4,700 episodes to 22% or 9,900 episodes)
    • within the amphetamines group, methamphetamine was reported as the principal drug of concern in almost half (48%) of episodes in 2012–13, rising to 63% in 2017–18 before a considerable increase to 93% in 2021–22 (Figure NSW 3a)
    • the rise in episodes may be related to increases in funded treatment services and/or improvement in agency coding practices for methamphetamines (Figure NSW 2, Table ST NSW.6)
  • cannabis is the third most common principal drug of concern, decreasing from 21% to 16% in 2021–22 (Figure NSW 2, Table ST NSW.6).

Treatment

In 2021–22, for treatment episodes in New South Wales:

  • counselling was the most common main treatment provided (41% of episodes), followed by support and case management (16%) and withdrawal management (13%)
  • where an additional treatment was provided as a supplementary to the main treatment, ‘other’ treatment (13.6%) was the most common, followed by counselling (7.2%) (Table ST NSW.13). See technical notes for further information on calculating proportions for additional treatment type.

Over the period 2012–13 to 2021–22:

  • counselling remained the most common treatment type for all episodes relative to other treatment types, rising from 36% (12,600 episodes) in 2012–13 to 42% (16,100) in 2016–17, dropping to 41% (18,500) in 2021–22
  • withdrawal management episodes have fallen in the 10 years to 2021–22 from 18% (6,200 episodes) to 13% (5,600 episodes) (tables ST NSW.13, NSW.15).

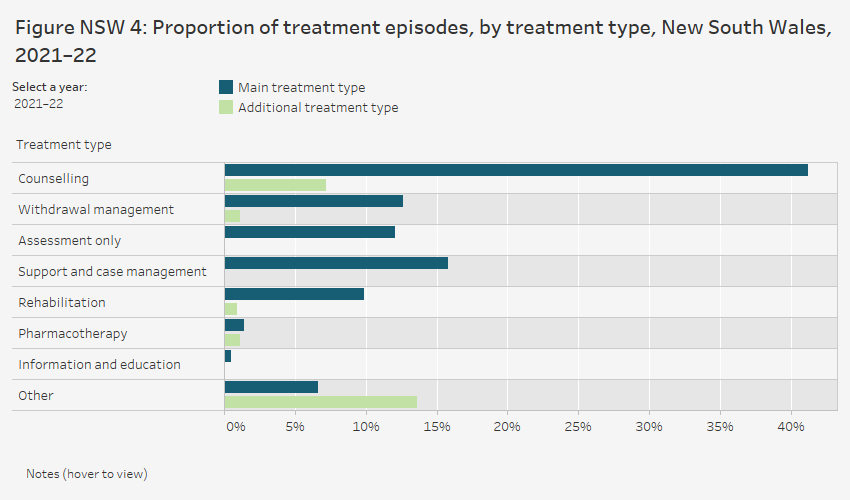
The grouped horizontal bar chart shows that, in 2020–21, the most common main treatment type provided to clients in New South Wales for their own drug use was counselling (40.0% of episodes). This was followed by withdrawal management (14.4%) and support and case management (14.1%).  ‘Other’ was the most common additional treatment type (8.0%), followed by counselling (6.8%).


Agencies

In 2021–22, in New South Wales:

  • over 6 in 10 (61%) AOD agencies were government treatment agencies
  • the majority (62%) of the 475 publicly funded treatment agencies were located in Major cities, followed by Inner regional areas (31%)
  • agencies located in Major cities provided almost 2 in 3 (65%) of all treatment episodes  
  • less than 1% of treatment agencies were located in Remote or Very remote areas – these provided less than 1% of all treatment episodes (176 episodes)
  • across all remoteness areas, the majority of agencies were government agencies, ranging from 60% in Major cities to 100% in Very remote areas (Figure NSW 5, tables Agcy.1, Agcy.3–4).

In the period 2012–13 to 2021–22, the number of publicly funded treatment agencies in New South Wales rose from 245 to 475 (Table Agcy.1).

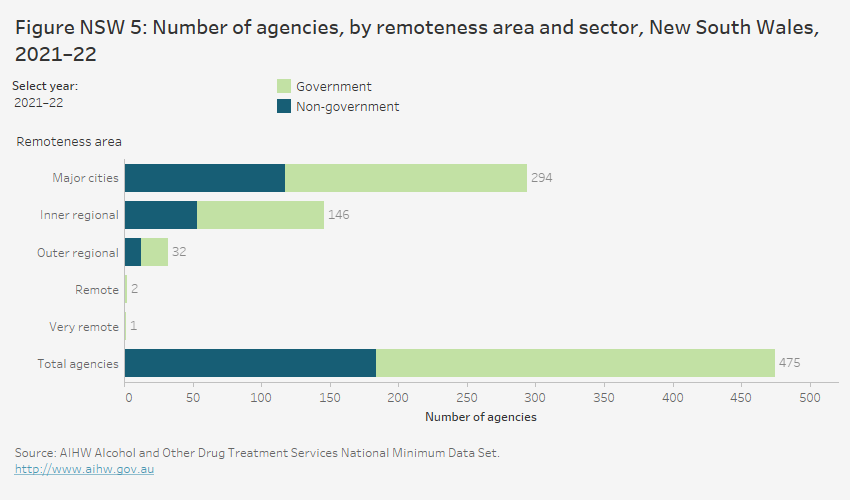
The horizontal bar chart shows that most treatment agencies in New South Wales in 2021–22 were located in Major cities (294 agencies), followed by Inner regional areas (146 agencies) and Outer regional areas (32 agencies). 3 treatment agencies were located in Remote and Very remote areas. Of the total 475 treatment agencies, 61.3% 291agencies) were government agencies.