Queensland

In 2021–22, 182 publicly funded alcohol and other drug treatment agencies in Queensland provided 49,674 treatment to 34,565 clients (tables Agcy.1, SCR.21).

Queensland reported:

  • a 1.9% decrease in treatment episodes from 50,600 in 2020–21 to 49,700 in 2021–22, and a 63% increase in treatment episodes since 2012–13 (30,600) (Table ST QLD.2)
  • more clients are using AOD services in 2021–22 than 2013–14, after adjusting for population growth (748 clients per 100,000 population compared with 714 per 100,000, respectively)
  • client numbers increased from 29,000 in 2013–14 to 34,600 in 2021–22 (Table SCR.21).

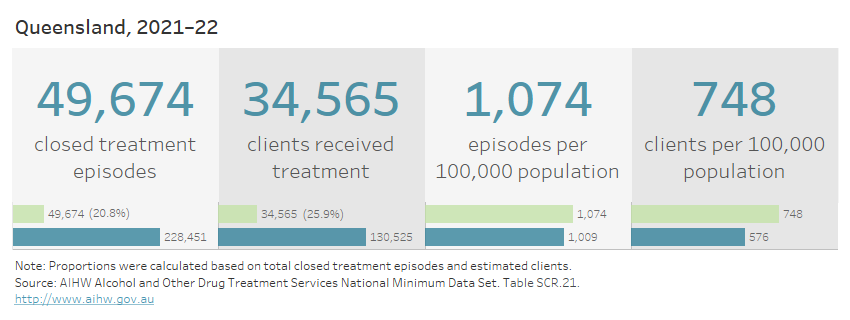
The visualisation shows that 49,674 treatment episodes were provided to 34,565 clients in Queensland in 2021–22. This equates to a rate of 1,074 episodes and 748 clients per 100,000 population, which is higher than the national rate (1,009 episodes and 576 clients per 100,000 population).

In 2021–22, most (85%) clients in Queensland attended 1 agency, and received an average of 1.4 treatment episodes, which is lower than the national average of 1.8 treatment episodes (tables SCR.21, SCR.23).


Client demographics

In 2021–22:

  • nearly all (97%) clients in Queensland received treatment for their own alcohol or drug use, of which over 6 in 10 (63%) people were male (Figure QLD 1)
  • clients seeking treatment for someone else's alcohol or drug use were more likely to be female (around 2 in 3 or 66%)
  • one in 2 (50%) people were aged 20–39 years, and 13% were aged 10–19 years which is higher than the national proportion (10%)
  • about 1 in 5 (19%) of all clients identified as Indigenous Australians, which is consistent with the national proportion (18%)
  • the majority (89%) of all clients were born in Australia and nearly all (99%) reported English as their preferred language (tables SC QLD.1–3, SC.3–4, SC QLD.21–22).

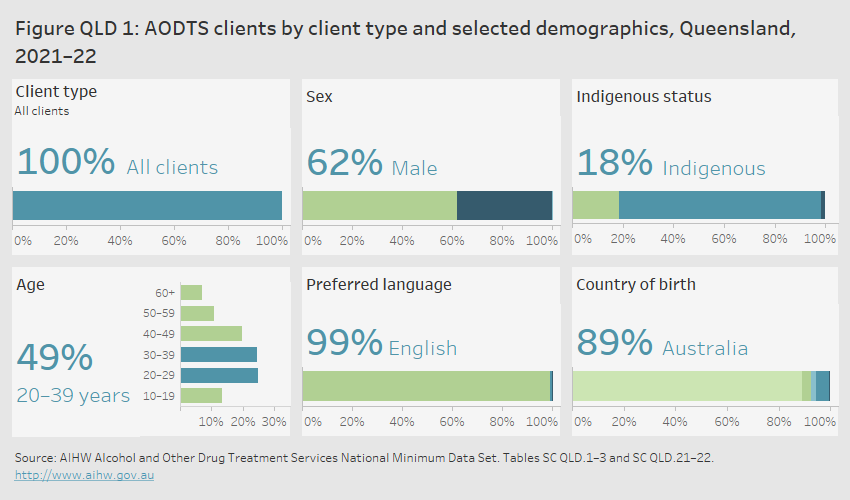
The visualisation includes a series of horizontal bar graphs showing that, in 2021–22 in Queensland, 62% of all clients were male, 49% were aged 20–39 and 18% were Indigenous Australians. Nearly all clients (99%) listed English as their preferred language and most (89%) were born in Australia.

Patterns of service use

Over the period 2017–18 to 2021–22, 131,000 clients received treatment in Queensland. Of these clients, the majority received treatment in a single year (77% or 101,000):

  • 21,000 (16%) received treatment for the first time in 2021–22
  • a further 80,100 (61%) received treatment in only one of the five collection periods (excluding 2021–22) (Table SCR.28).

Drugs of concern

In 2021–22, for clients in Queensland receiving treatment episodes for their own alcohol or drug use:

  • alcohol was the most common principal drug of concern (39% or 19,100 episodes) (Figure QLD 2, Table ST QLD.6)
  • cannabis was the second most common principal drug of concern (24% or 11,800 episodes), followed by amphetamines (22% or 10,800). In Queensland, the level of cannabis reported as the principal drug of concern is a result of the police and illicit drug court diversion programs operating in the state (Table ST QLD.12).

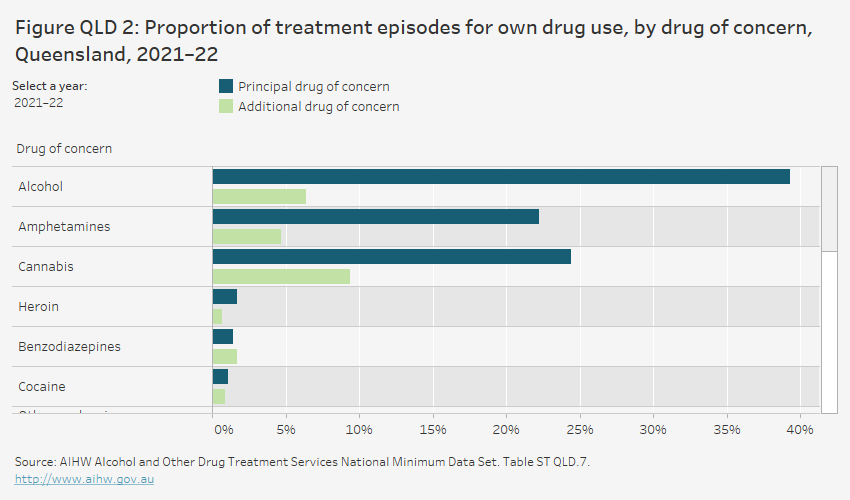
The grouped horizontal bar chart shows that, in 2021–22, alcohol was the most common principal drug of concern in treatment episodes provided to clients in Queensland for their own drug use (39.3%). This was followed by cannabis (24.4%) and amphetamines (22.2%). Cannabis was the most common additional drug of concern (9.4% of episodes), followed by alcohol (6.4%) and amphetamines (4.7%).

In 2021–22, for clients receiving treatment for their own use of amphetamines:

  • methamphetamine was reported as a principal drug of concern in over 9 in 10 (91%) treatment episodes (Figure QLD 3a)
  • in almost half (48%) of treatment episodes where methamphetamine was the principal drug of concern, injecting was the most common method of use, followed by smoking (39%) (Figure QLD 3b).

Queensland is working with service providers to encourage more specific reporting of amphetamine use (i.e. to reduce the use of ‘amphetamines not further defined’ code where possible).   

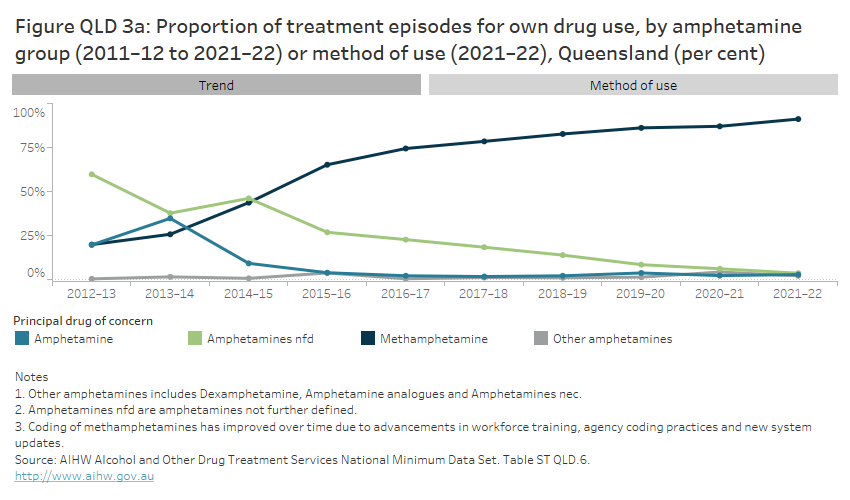
The line graph shows that, from 2012–13 to 2014–15, ‘amphetamines not further defined’ was the most common drug of concern among amphetamine-related treatment episodes for clients’ own drug use. In 2015–16, methamphetamine became the most common drug of concern. The proportion of episodes for amphetamines not further defined decreased from 2014–15 (46.2% of amphetamine-related episodes) to 2021–22 (3.7%), while episodes increased for methamphetamines (from 43.7% to 91.2%). Buttons allow the user to navigate to data on method of use of amphetamines.

Clients can nominate up to 5 additional drugs of concern; these drugs are not necessarily the subject of any treatment within the episode (see technical notes).  When clients reported additional drugs of concern, cannabis was the most common additional drug (9.4% of episodes), followed by alcohol (6.4%) and nicotine (5.2%) (Table ST QLD.7).

Over the period 2012–13 to 2021–22:

  • alcohol was the most common principal drug of concern from 2012–13 to 2014–15, and in 2018–19 replaced cannabis as the most common principal drug of concern (Table ST QLD.7)
    • the proportion of episodes for alcohol as a principal drug of concern increased from 37% in 2012–13 to 39% in 2021–22, relative to all other principal drugs of concern. However, the number of treatment episodes almost doubled over this period from 10,700 episodes to 19,100.
  • cannabis was the second most common principal drugs of concern, with treatment episodes increasing from 34% in 2012–13, peaking at 39% in 2015–16 and falling to 24% in 2021–22. From 2012–13 to 2021–22, treatment episodes increased from 10,050 to 11,800
  • the proportion of episodes for amphetamines as a principal drug of concern doubled since 2012–13 (11% to 22%), with the number of treatment episodes increasing from 3,200 to 10,800 over this period
    • within the amphetamines group, methamphetamine was reported as the principal drug of concern in 20% of episodes in 2012–13, rising to 65% in 2015–16, then 91% in 2021–22 (Figure QLD 3a)
    • The rise in episodes where methamphetamines were the principal drug of concern may be related to increases in funded treatment services and improvements in agency coding practices for methamphetamines.
  • the proportion of treatment episodes in Queensland where cannabis was the principal drug of concern was higher than the national proportion in 2021–22 (24% compared with 19%) (Table Drg.1). This trend has been consistent for the 10-year period.

Treatment

Changes to AOD reporting in Queensland

In 2020­–21, Queensland Health transitioned to an integrated public AOD and mental health system for reporting. Due to the use of this integrated system, there was an improvement in the capability to report assessment only as a main treatment type. This resulted in increases in treatment episodes with assessment only as a main treatment type and is considered as a more accurate representation of the treatment being provided by the sector.

Prior to 2020–21, treatment episodes provided to people diverted into AOD services by police and court diversion programs were recorded as information and education. This resulted in a high proportion of information and education treatment episodes in Queensland. From 2020–21, the police and court diversion programs are now reported as counselling which is a more accurate representation of the treatment being provided. See Data Quality Statement for further information.  

In 2021–22, for treatment episodes in Queensland:

  • counselling was the most common main treatment (44% of episodes), followed by assessment only (32%) (Figure QLD 4)
  • the proportion of episodes for information and education as a main treatment dropped 16 percentage points from 2019–20 (21%) to 5.0% in 2021–22. This was due to a review of coding practices which resulted a large proportion of episodes previously coded as information and education being coded as counselling (Table ST QLD.13)
  • where an additional treatment was provided as supplementary to the main treatment, information and education (1.7%) was also the most common type of additional treatment, followed by support and case management (1.6%). See technical notes for further information on calculating proportions for additional treatment type.

Over the period 2012–13 to 2021–22:

  • the proportion of all treatment episodes where counselling was the main treatment type increased from 33% in 2012–13 to 44% in 2021–22. Counselling replaced information and education as the most common treatment in 2016–17
  • the proportion of withdrawal management as a main treatment type decreased since 2012–13, dropping from 9.7% down to 3.8% in 2021–22.

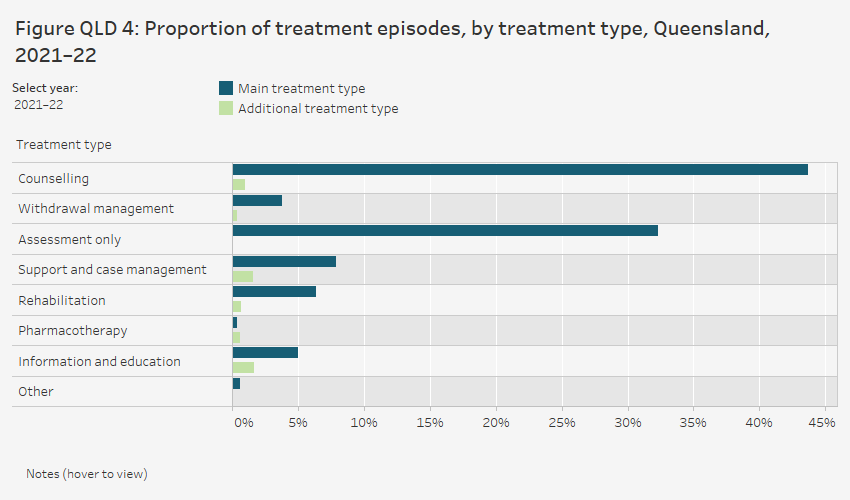
The grouped horizontal bar chart shows that, in 2021–22, the most common main treatment type provided to clients in Queensland for their own drug use was counselling (43.7% of episodes). This was followed by assessment only (32.3%) and support and case management (7.9%). Information and education was the most common additional treatment type (1.7%), followed by counselling (1.6%).


Agencies

In 2021–22, in Queensland:

  • more than 7 in 10 (72%) AOD agencies that received public funding were non-government treatment agencies (Table Agcy.1)
  • almost half (45%) of the 182 treatment agencies were located in Major cities, followed by Outer regional (24%) and Inner regional (21%) areas
  • around 1 in 10 (9.9%) of all government treatment agencies were located in Remote and Very remote areas (Figure QLD 5; Table Agcy.3).

In the 10 years to 2021–22, the number of publicly funded treatment agencies in Queensland steadily increased from 133 in 2012–13 to 194 in 2019–20, falling to 182 in 2020–21 and 2021–22. The recent change in agency numbers is attributed to a review of the agency coding structure in the public sector.  As a result, there have been significant agency identifier changes which have been constructed to align with the Queensland Health Corporate Reference Database System, providing a more accurate representation of number of agencies reporting at the service outlet level (Table Agcy.1).

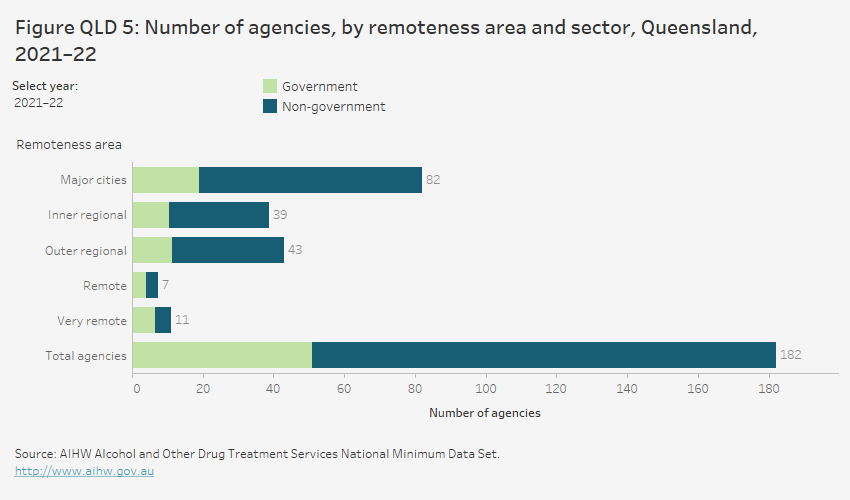
The horizontal bar chart shows that most treatment agencies in Queensland were located in Major cities (82 agencies), followed by Outer regional areas (43 agencies) and Inner regional areas (39 agencies) in 2021–22. 18 agencies were located in Remote and Very remote areas. Of the total 182 treatment agencies, 72% (131 agencies) were non-government agencies.