Western Australia

In 2021–22, 118 publicly funded alcohol and other drug treatment agencies in Western Australia provided 20,314 treatment episodes to 15,331 clients (tables Agcy.1, SCR.21).

Western Australia reported:

  • an 8.7% decrease in treatment episodes from 22,200 in 2020–21 to 20,300 in 2021–22, and a 1.5% decrease in episodes since 2012–13 (20,600) (Table ST WA.2)
  • less clients are using AOD services in 2021–22 than 2013–14, after adjusting for population growth (636 compared with 697 per 100,000 population, respectively)
  • client numbers increased from 2013–14 (15,146) to 2018–19 (19,300), decreasing to 15,300 in 2021–22 (Table SCR.21).

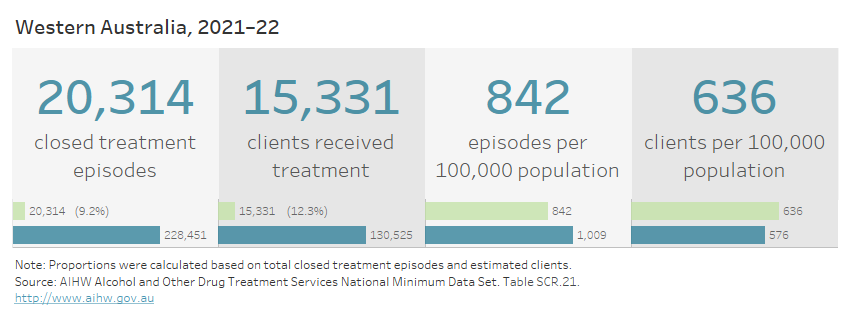
The visualisation shows that 22,245 treatment episodes were provided to 17,195 clients in Western Australia in 2020–21. This equates to a rate of 957 episodes and 740 clients per 100,000 population, compared with the national rate of 1,079 episodes and 618 clients per 100,000 population.

In 2021–22, most (85%) clients in Western Australia attended 1 agency, and received an average of 1.3 treatment episodes, which is lower than the national average of 1.8 treatment episodes (tables SCR.21, SCR.23).


Client demographics

In 2021–22:

  • most (94%) clients in Western Australia received treatment for
    their own alcohol or drug use, of which 2 in 3 (64%) were male (Figure WA 1)
  • almost 8 in 10 people seeking treatment for someone else’s alcohol or drug use were female (78%)
  • over half (54%) of the people receiving treatment for their own alcohol or drug use were aged 20–39 years; in contrast, people seeking treatment for someone else’s alcohol or drug use were more likely to be aged 50 and over (50%)
  • 1 in 5 (20%) of all clients identified as Indigenous Australians, which is higher than the national proportion (18%)
  • the majority (82%) of all clients were born in Australia and nearly all (98%) reported English as their preferred language (tables SC WA.1–3, SC.4, SC WA.21–22).

The visualisation includes a series of horizontal bar graphs showing that, in 2020–21, just under two-thirds (62%) of all clients were male, 54% were aged 20–39 and 22% were Indigenous Australians in Western Australia. Nearly all clients (99%) listed English as their preferred language and most (83%) were born in Australia.

Patterns of service use

Over the period 2017–18 to 2021–22, 65,200 clients received treatment in Western Australia. Of these clients, the majority received treatment in a single year (73% or 47,900):

  • 8,700 (13%) received treatment for the first time in 2021–22
  • a further 39,100 (60%) received treatment in only one of the five collection periods (excluding 2021–22) (Table SCR.28).

Drugs of concern

In 2021–22, for clients in Western Australia receiving treatment episodes for their own alcohol or drug use, alcohol was the most common principal drug of concern (46% or 9,000 episodes), followed by amphetamines (22% or 4,300) (Figure WA 2, Table ST WA.6).

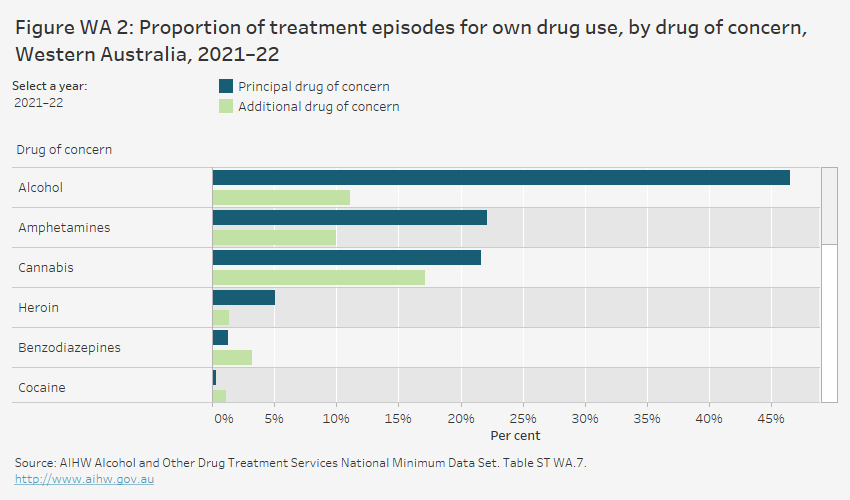
The grouped horizontal bar chart shows that, in 2021–22, alcohol was the most common principal drug of concern in treatment episodes provided to clients in Western Australia for their own drug use (46.5%). This was followed by amphetamines (22.1%) and cannabis (21.6%). Cannabis was the most common additional drug of concern (17.1% of episodes), followed by alcohol (11.1%) and amphetamines (10.0%).

In 2021–22, for clients receiving treatment for their own use of amphetamines:

  • methamphetamine was reported as a principal drug of concern in over 9 in 10 (91%) treatment episodes
  • in over half of treatment episodes where methamphetamine was the principal drug of concern, injecting was the most common method of use (52%), followed by smoking (43%) (Figures WA 3a, WA 3b).

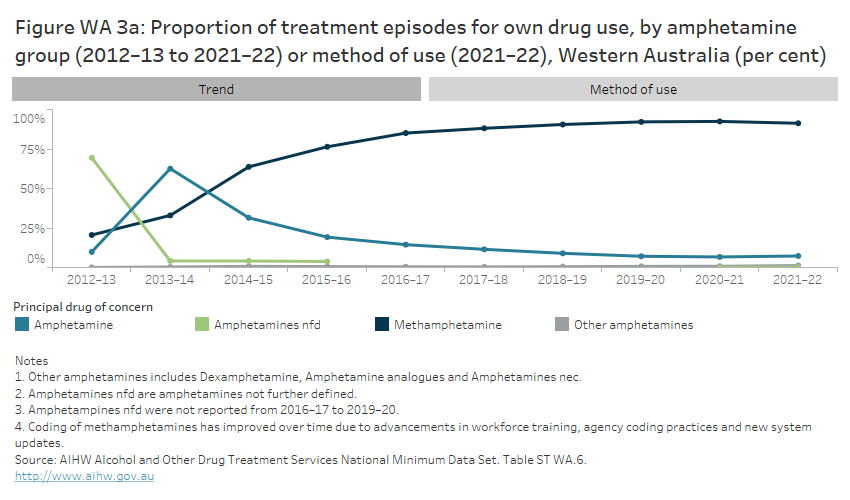
The line graph shows that, from 2012–13 to 2013–14, amphetamine and ‘amphetamines not further defined’ were the most common drugs of concern among amphetamine-related treatment episodes for clients’ own drug use. In 2014–15, methamphetamine became the most common drug of concern. The proportion of episodes for methamphetamine increased from 20.6% in 2012–13 to 91.3% in 2021–22. Buttons allow the user to navigate to data on amphetamines by method of use. 

Clients can nominate up to 5 additional drugs of concern, but these drugs are not necessarily the subject of any treatment within the episode (see technical notes).

In 2021–22, when the client reported additional drugs of concern, cannabis was the most common additional drug (17% of episodes), followed by nicotine and alcohol (both 11%) and amphetamines (10%) (Table ST WA.7).

Over the period 2012–13 to 2021–22:

  • the proportion of treatment episodes for alcohol as a principal drug of concern relative to all other principal drugs of concern fell from 39% (7,700) in 2012–13 to 29% in 2016–17 (6,700), rising to 46% (9,000 episodes) in 2021–22
  • the proportion of treatment for amphetamines as a principal drug of concern increased from 20% in 2012–13, peaking at 36% in 2016–17 then falling to 22% in 2021–22 (Table ST WA.6)
    • within the amphetamines group, methamphetamine was reported as the principal drug of concern in 21% of episodes in 2012–13, rising to 91% in 2021–22 (Figure WA 3a)
  • cannabis remained relatively steady between 2012–13 and 2021–22, ranging from 23% of treatment episodes in 2012–13, peaking at 25% in 2013–14 and falling to 22% in 2021–22.

Treatment

In 2021–22, for treatment episodes in Western Australia, counselling was the most common main treatment (66% of episodes), followed by support and case management 11% (Figure WA 4, Table ST WA.13).

The majority of services who submit AODTS NMDS data use Western Australia’s data collection system, which does not differentiate between main and other treatment types. A small proportion of services who submit AODTS NMDS data use their own data collection systems, which do differentiate between main and other treatment types.

Over the period 2012–13 to 2021–22:

  • counselling remained the most common main treatment for all episodes. The proportion of episodes where counselling was a main treatment type remained substantially higher in Western Australia than nationally over the period, ranging from 60% to 71% in Western Australia compared with 36% to 43% nationally (tables ST WA.13, Trt.3)
  • the next most common main treatment types were support and case management (4.5% to 11% of episodes) and withdrawal management (5.6% to 14%).

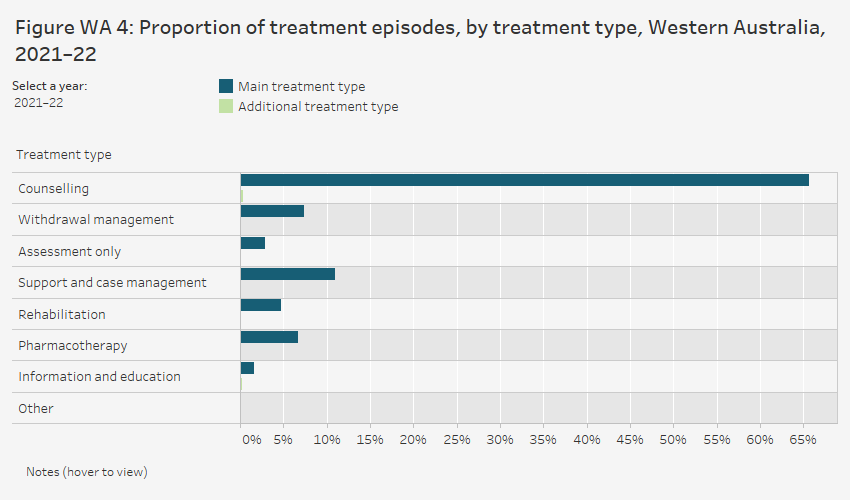
The grouped horizontal bar chart shows that, in 2021–22, the most common main treatment type provided to clients in Western Australia for their own drug use was counselling (65.6% of episodes). This was followed by support and case management (11.0%) and withdrawal management (7.4%).


Agencies

In 2021–22, in Western Australia:

  • just under 9 in 10 (89%) AOD agencies that received public funding were non-government treatment agencies (Table Agcy.1)
  • almost 3 in 5 (57%) of the 118 treatment agencies were located in Major cities (Figure WA 5, Table Agcy.3)
  • Very remote areas were the only areas where there were more government than non-government agencies (8 and 5, respectively).

In the 10 years to 2021–22, the number of publicly funded treatment agencies in Western Australia rose from 68 to 118 (Table Agcy.1).

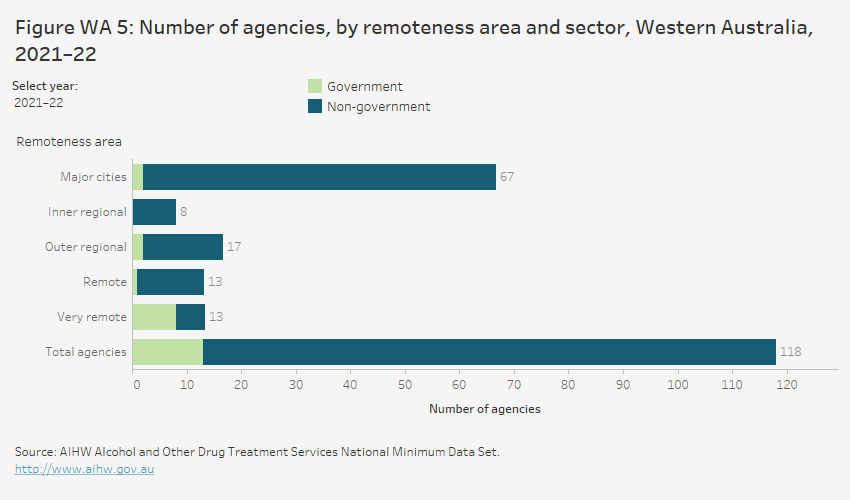
The horizontal bar chart shows that most treatment agencies in Western Australia were located in Major cities (67 agencies), followed by Outer regional areas (17 agencies) and Remote and Very remote areas (13 agencies each) in 2021–22. 8 agencies were located in Inner regional areas. Of the total 119 treatment agencies, 89% (105 agencies) were non-government agencies.