What services do we use?
Australia spends about $155 billion a year on health—a sector that includes more than 1,300 hospitals, employs about 385,000 nurses, midwives and medical practitioners, and provides a diverse range of services. This section looks at some of the key components of the health system, including services, the people employed in the health workforce and expenditure.
An average day in health care
Australia's health system is a complex network of public and private services and providers. On an average day in Australia there are:
616,000 subsidised prescriptions dispensed
381,000 visits to a general practitioner (GP)
246,000 pathology tests
79,000 visits to a specialist
27,000 hospitalisations—59% in the public sector
27,000 allied health services provided
24,000 contacts made at community mental health care services
20,000 presentations to public hospital emergency departments—30% end up being admitted to hospital
1,900 people admitted for elective surgery in public hospitals—9% for cataract extraction
It all begins with primary health care
Primary health care is typically the first contact a person has with the health system. Primary health broadly encompasses health care that is not related to a hospital visit or specialised care. GPs, nurses, nurse practitioners, allied health professionals (for example, physiotherapists), midwives, dentists, and Aboriginal health workers are all considered primary health care professionals.
In Australia:
- in 2013-14, primary health care accounted for 38% (or $55 billion) of total recurrent health expenditure
- in 2014-15, there were 139 million non-referred encounters with GPs claimed through Medicare—from a total of 335 million out-of-hospital services. Other Medicare-funded out-of-hospital services included pathology and allied health such as physiotherapy.
In 2014-15, the most common problems managed by GPs differed through the life stages:
| Gender | Under 5 | 5-14 | 15-24 | 25-44 | 45-64 | 65-74 | 75-84 | 85+ |
|---|---|---|---|---|---|---|---|---|
| Males | Upper respiratory infection, acute | Upper respiratory infection, acute | Upper respiratory infection, acute | Upper respiratory infection, acute | Hypertension | Hypertension | Hypertension | Hypertension |
| Females | Upper respiratory infection, acute | Upper respiratory infection, acute | Oral contraception | Pregnancy | Hypertension | Hypertension | Hypertension | Hypertension |
Indigenous-specific primary health care services help improve access to care
In 2014-15, there were 203 Indigenous-specific primary health care organisations that reported data nationally. They provided services to 434,600 clients through over 5 million contacts—an average of 12 contacts per client. Over three-quarters (79%) of these clients identified as Aboriginal and Torres Strait Islander people. Over time, the episodes of health care provided to clients of these organisations have almost tripled, from 1.2 million in 1999-2000 to 3.5 million in 2014-15, with almost twice as many organisations reporting data in 2014-15 compared with 1999-2000.
Services provided included clinical health care; population health programs; child and maternal health services; screening programs and health checks; access to allied health and specialist services; group activities; health-related community services; and substance-use treatment and assistance.
Services provided by Indigenous-specific primary health care organisations help to address barriers that can prevent Indigenous people from accessing health care, including cost and cultural appropriateness. As well, some areas where Indigenous people live (especially Very remote areas) have poor access to GP services and no Indigenous-specific primary health care services within an hour's drive. This can make it difficult to access care when it is needed.
Roles of public and private hospitals differ
Australia's 1,300 public and private hospitals provide emergency department care, outpatient clinic care and care for admitted patients.
In 2013-14:
- public hospitals provided the majority of Australia's emergency department care (94%) and outpatient care (96%)
- private hospitals were more likely to deliver elective surgery (67% of all elective surgery was performed in private hospitals).
| Care service | 747 public hospitals | 612 private hospitals |
|---|---|---|
| Hospitalisations | 5.7 million An increase of 3.0% per year since 2009-10 |
4.0 million An increase of 3.6% per year since 2009-10 |
| Beds | 58,568 An increase of 0.7% per year since 2009-10 |
30,920 An increase of 2.7% per year since 2009-10 |
| Beds per 1,000 population | 2.5 Similar to 2.6 beds in 2009-10 |
1.3 Same as 1.3 beds in 2009-10 |
| Days of patient care provided | 18.8 million An increase of 1.0% per year since 2009-10 |
9.1 million An increase of 2.3% per year since 2009-10 |
How long are we waiting?
Emergency departments
In 2014-15, 50% of patients waited 18 minutes or less for clinical care to begin.
Proportion of patients seen on time by triage category, Australia, 2014-15
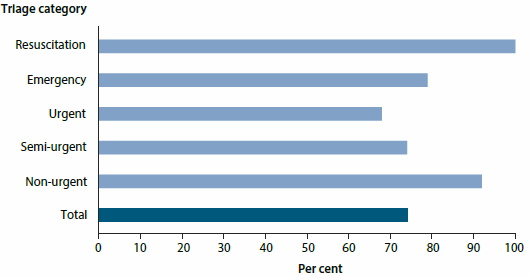
Different maximum wait times are considered appropriate depending on how urgently a person presenting to the emergency department needs care. For example, Resuscitation patients need to be seen immediately.
In 2014-15, about 74% of all emergency presentations were seen 'on time', including almost 100% of Resuscitation patients, and 79% of Emergency patients (who need to be seen within 10 minutes).
The overall proportion of patients seen on time was higher than in 2010-11, when 70% were seen on time, but slightly lower than the 75% in the previous year (2013-14).
Elective surgery
Although private hospitals perform 67% of elective surgery, national waiting time information is only reported for public hospitals.
In 2014-15, 50% of patients were admitted within 35 days of being placed on the elective surgery waiting list, 90% were admitted within 253 days and 1.8% waited more than 1 year. The median waiting time is lower than it was between 2010-11 and 2013-14 (36 days).
The median waiting time for Indigenous Australians (42 days) was higher than for other Australians (35 days), and a higher proportion of Indigenous Australians waited more than a year for elective surgery than other Australians (2.3% and 1.8%, respectively).
The longest median waiting times were for the surgical specialties Ear, nose and throat surgery; Ophthalmology; and Orthopaedic surgery (73, 70, and 64 days, respectively). Cardio-thoracic surgery had the shortest median waiting time (18 days).
Something to smile about
Good oral health allows people to participate in everyday tasks such as eating and talking without experiencing pain or embarrassment and is an integral part of good general health.
In 2013, about two-thirds (64%) of people aged 5 and over had made a dental visit in the previous year. Among children aged 5-14, 79% had visited in the previous year, and 91% in the previous 2 years.
The age group with the lowest proportion of dental visits was adults aged 25-44, with 55% visiting in the previous year, and 75% visiting in the previous 2 years.
In 2013, almost one-third (32%) of people reported delaying or avoiding a visit to the dentist due to cost. People without private health insurance were twice as likely (44%) as those with insurance (20%) to avoid visiting a dentist due to cost.
Of people who did visit a dentist in the previous 12 months, 20% did not have the recommended dental treatment due to cost.
Alcohol and cannabis top reasons for seeking treatment
Alcohol and other drug treatment services help people to manage their drug use through a range of treatments that can assist them to reduce or stop their drug use, and improve social and personal functioning. Services are also provided to support the family and friends of people using drugs.
Around 115,000 clients received treatment and support services from publicly funded alcohol and other drug treatment services in 2014-15, most commonly for alcohol. Around 2 in 5 (38%) of treatment episodes were for alcohol, followed by cannabis (24%), amphetamines (20%) and heroin (6%). Almost all (95%) were for the client's own drug use.
Clients by principal drug of concern and age group, Australia, 2014-15
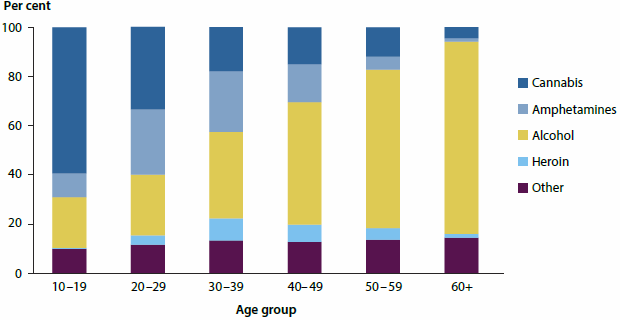
The proportion of clients receiving treatment for alcohol increases substantially with age, while it is the opposite for cannabis.
A variety of services for mental health
In Australia, people with mental illness have access to a variety of treatment and care services provided by a variety of professionals in a range of settings.
In 2013-14, public community mental health care services provided more than 8.7 million contacts. Around one-quarter of all contacts were for patients with a principal diagnosis of schizophrenia.
In 2013-14, there were 240,000 mental health-related hospitalisations and 280,000 mental health-related emergency department services.
An estimated $7.6 billion, or $332 per capita, was spent on mental health-related services in 2012-13. After adjusting for inflation, this increased by an annual average of 6.4% in the 5 years to 2012-13.
Where might people go for mental health care?
- Specialised hospital services, public and private
- Residential mental health care services
- Community mental health care services
- Private clinical practices
- Non-government organisation services
End-of-life care mostly provided outside the home
Australia's population is growing and ageing, with the number of people who will die each year estimated to double in the next 25 years. This is inevitably increasing the demand for high quality, end-of-life care that meets the needs and expectations of those dying and their loved ones.
End-of-life care typically refers to care received in the 12 months prior to death and is provided in many health care settings, including neonatal units, paediatric services, public and private acute hospitals, general practices, and through residential and community aged care services. Support services are also delivered to people in their own homes. (Although services targeted towards older Australians provide the majority of end-of-life care, around 20% of deaths each year are for people aged under 65.)
The end-of-life experience for most Australians has become increasingly institutionalised over the last century, with only around 20% dying outside of hospital or residential aged care in the first decade of the 21st century. This is at odds with the desire of most Australians to die at home and is one of the lowest rates in the developed world.
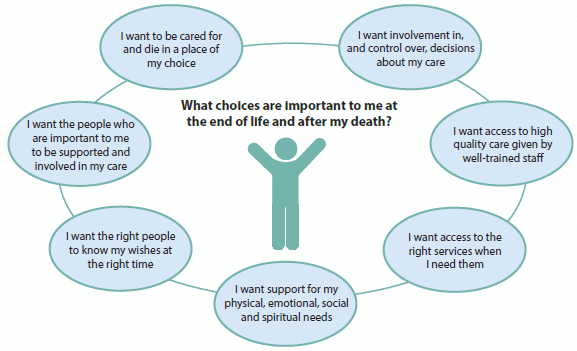
Source: Adapted from The Choice in End-of-life Care Programme Board 2015.
Growth in expenditure relatively low
Health spending includes money spent by governments as well as by individuals and other non-government funders, such as private health insurers.
In 2013-14, an estimated $155 billion was spent on health in Australia, of which $145 billion was recurrent spending.
Over recent decades, health expenditure has tended to grow from year to year, faster than the growth rates for inflation, the population or the economy. In the past 2 years, however, growth in health expenditure has been relatively slow: the real growth rate was 1.1% from 2011-12 to 2012-13 and 3.1% from 2012-13 to 2013-14, both lower than the average 5.0% annual growth over the preceding decade.
Hospitals spending highest for cardiovascular disease
In 2012-13, around $5 billion of admitted patient expenditure was on cardiovascular disease—it was the most expensive disease group, followed by injuries.
Disease or condition group expenditure, 2004-05 and 2012-13, Australia, adjusted for inflation
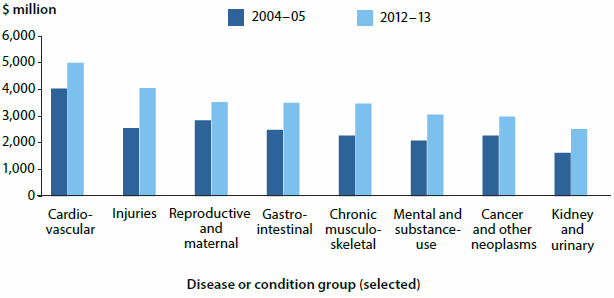
Between 2004-05 and 2012-13, adjusting for inflation, the pattern of admitted patient expenditure changed, with higher expenditure, particularly in the over-50 age groups. This reflects both an increase in spending per person, as well as an increase in the number of people in each age group.
Nurses and midwives are largest group in the health workforce
The health workforce in Australia is large and diverse, covering many occupations, and ranging from highly qualified professionals to support staff and volunteers.
| Health workforce | Nurses and midwives | Medical practitioners |
|---|---|---|
| Employed | 300,979 employed in 2014, up 5.0% from 286,706 in 2011 |
85,510 employed in 2014, up 7.4% from 79,653 in 2012 |
| Full-time equivalent per 100,000 population | 1,134 in 2014, up 2.4% from 1,107 in 2011 |
387 in 2014, up 3.6% from 374 in 2012 |
| Percentage of women | 89% in 2014, about the same as in 2011—90% |
39% in 2014, about the same as in 2012—38% |
Rounding out the top 5:
3rd: Psychologists 23,878
4th: Pharmacists 22,500
5th: Physiotherapists 22,412
Together, these five professions account for around 88% of all employed registered professionals in the health workforce.