Summary
Living with illness or injury accounts for just over half the burden
In 2023, Australians lost 5.6 million years of healthy life (total burden, DALY) due to:
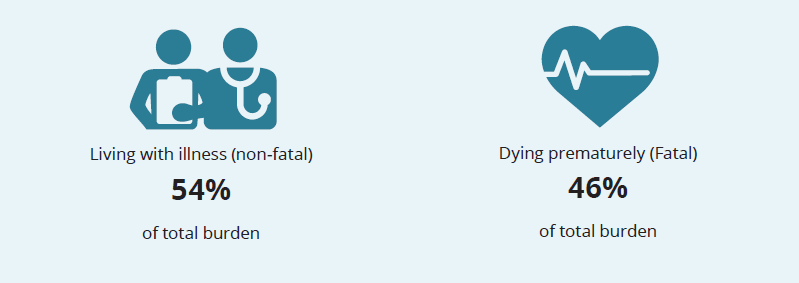
Living with illness or injury caused more disease burden than dying prematurely. Between 2003 and 2023, there has been a moderate shift from fatal burden to non-fatal burden being the biggest contributor to total burden (Figure 1.1). This is mostly driven by fewer premature deaths in recent years.
Figure 1.1: Proportion (%) of total burden due to fatal and non-fatal burden in 2003 and 2023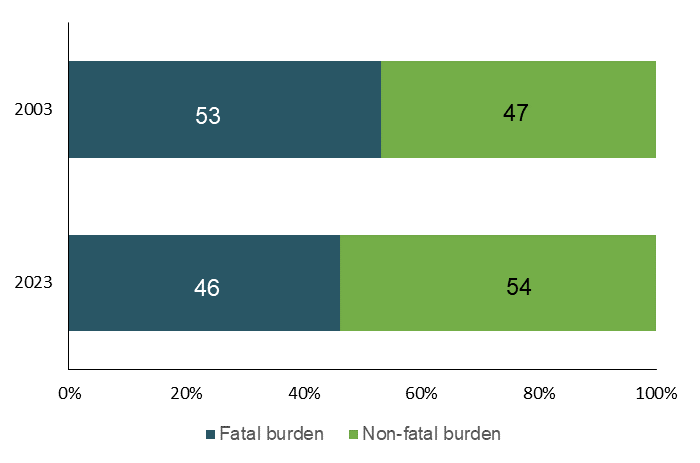
Source: AIHW Australian Burden of Disease Database.
To further explore the contribution of fatal and non-fatal burden over time, refer to the interactive data visualisations: Burden of disease in Australia and Fatal vs. non-fatal burden.
Long-term improvements in fatal burden but recent increases in non-fatal burden
Over the 20-year period from 2003 to 2023, the rate of total disease burden (the crude rate) was relatively similar (212 DALY per 1,000 population in 2003 compared with 213 DALY per 1,000 population in 2023). Underlying this was a 13% decrease in the rate of fatal burden while the rate of non-fatal burden increased by 15% over that period.
After adjusting for population ageing, there was an 11% decline in the age-standardised rate of total burden between 2003 and 2023 (Figure 1.2). This was driven by a 27% decrease in the rate of fatal burden, as the non-fatal burden rate increased by 6.3%.
Note that when compared with 2018, age-standardised rates for 2023 were higher for non-fatal, lower for fatal burden and similar for total burden. Impacts due to the COVID‑19 pandemic may have caused or affected the burden due to other causes, including impacts due to restrictions and lockdowns. Therefore, simply subtracting the disease burden due to COVID‑19 from the total burden does not necessarily reflect the true disease burden experienced had the COVID‑19 pandemic not occurred.
Figure 1.2: Change in the age-standardised total burden (DALY), fatal burden (YLL) and non-fatal burden (YLD) rate (per 1,000 population) between 2003 and 2023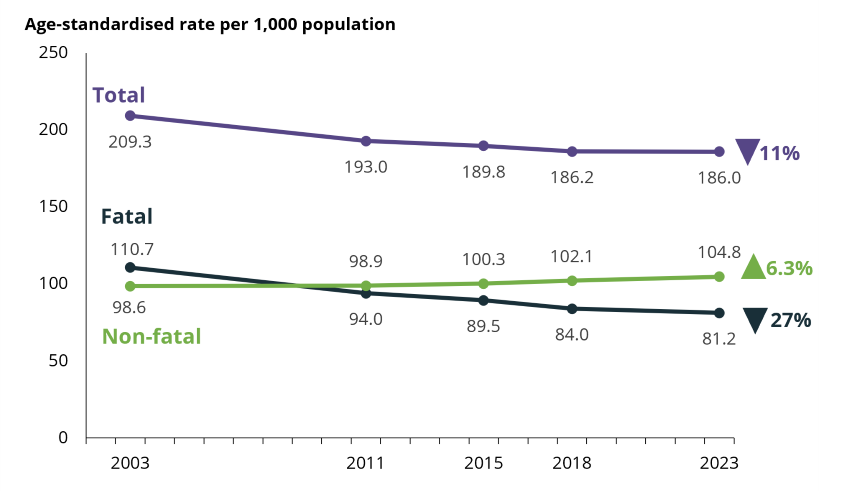
Source: AIHW Australian Burden of Disease Database.
Chronic diseases cause most of the burden
In 2023, the 5 disease groups causing the most burden were cancer, mental health conditions & substance use disorders, musculoskeletal conditions, cardiovascular diseases and neurological conditions (Table 1.1).
Together these disease groups accounted for around two-thirds (64%) of the total burden. These disease groups include mostly chronic, or long-lasting, conditions.
| Cancer | Mental health & substance use | Musculoskeletal | Cardiovascular | Neurological | |
|---|---|---|---|---|---|
| % of total DALY | 17 | 15 | 13 | 12 | 8 |
| % of total DALY that was fatal | 91 | 2 | 3 | 74 | 49 |
| Change in age-standardised rates between 2003 and 2023(a) |  Decreased Decreased |  Increased Increased | Decreased | Decreased | Increased |
(a) Based on the rate difference; that is, the absolute difference between the age-standardised rate of burden from 2003 to 2023.
Source: AIHW Australian Burden of Disease Database.
See the Fatal vs. non-fatal burden interactive data visualisation to explore the contribution of fatal and non-fatal burden to total burden by disease group or by specific disease or injury.
Males and females experience disease burden differently
Overall and for most age groups, males experienced more total burden than females. This was driven by males having higher rates of fatal burden.
In 2023, the leading causes of total burden among males were coronary heart disease, back pain & problems and suicide & self-inflicted injuries (Figure 1.3). Among females, the leading cause was dementia, followed by anxiety disorders and back pain & problems.
Males experienced 3 times the amount of burden due to suicide & self-inflicted injuries and 2 times the amount of burden from coronary heart disease than females. Females experienced more burden than males from dementia and anxiety disorders.
Figure 1.3: Leading causes of total burden by sex and proportion (%) of total burden, 2023
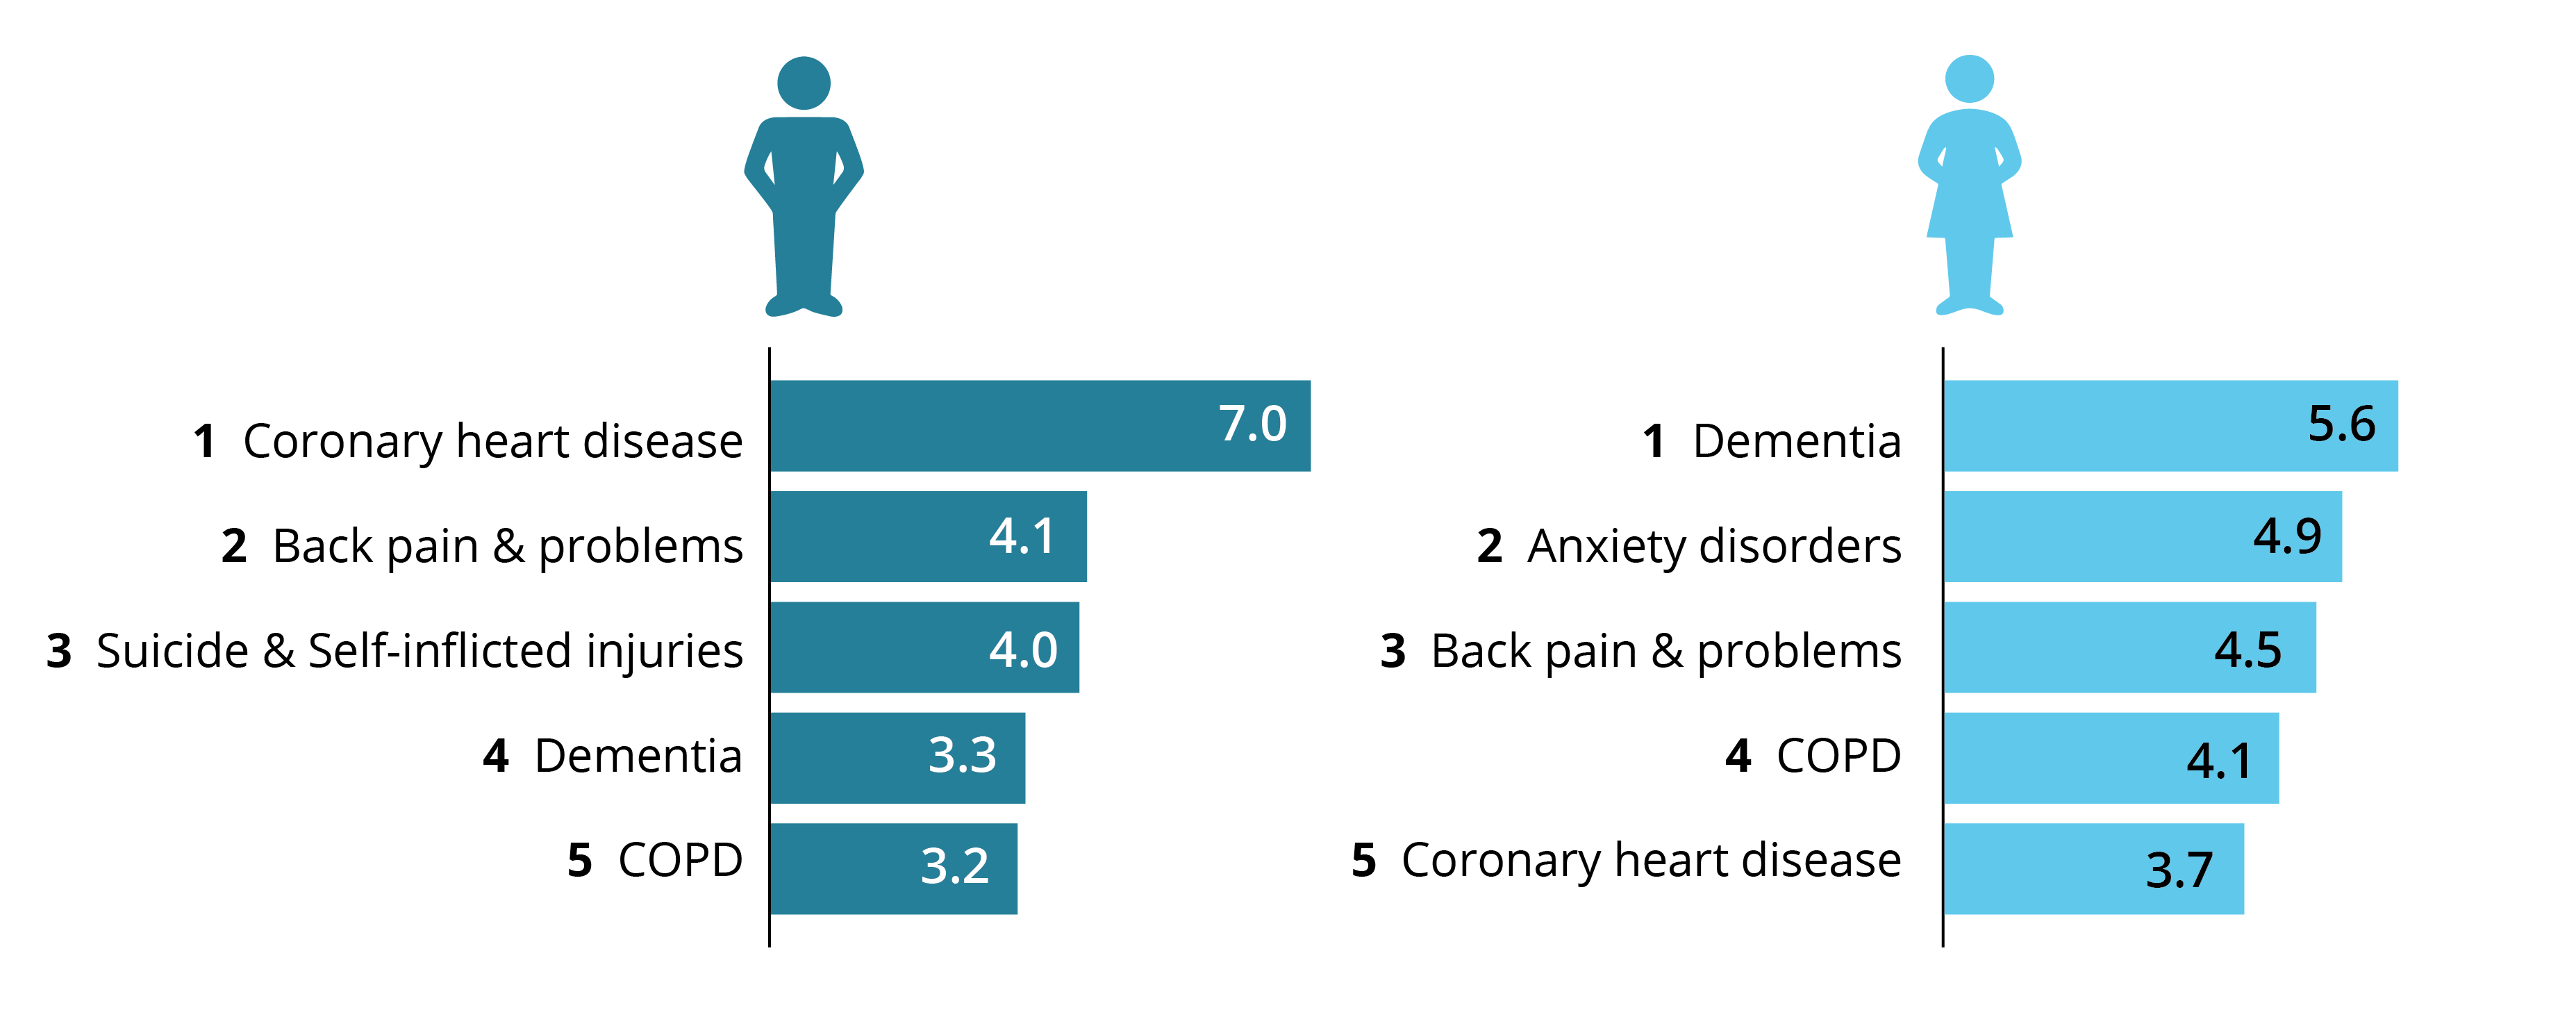
Source: AIHW Australian Burden of Disease Database.
Changes in leading specific causes of disease burden over time
Between 2003 and 2023, the crude rate of total burden:
- decreased for coronary heart disease, stroke, lung, bowel and breast cancer and rheumatoid arthritis.
- substantially increased for dementia, and its rank increased from the 12th leading cause of total burden in 2003 to the 2nd leading cause in 2023. However, this increase is partly due to changes in practices of coding deaths due to dementia (refer to Comparisons over time and Technical notes).
- increased for back pain & problems, anxiety disorders, chronic obstructive pulmonary disease (COPD), depressive disorders, osteoarthritis, asthma and type 2 diabetes.
Diseases that caused the most burden over the life course
Australians experience health loss from different diseases and injuries at various stages of life. Respiratory diseases caused burden throughout the life course, especially in children and the elderly. Mental health conditions & substance use disorders dominated the first half of the life course, while musculoskeletal conditions, cardiovascular diseases and cancer feature more prominently in the latter part of the life course. Neurological conditions (namely dementia) are a leading cause of burden in older Australians (aged 65 and over).
For more information, explore the interactive data visualisation for Leading causes of disease burden.
COVID‑19 burden
COVID‑19 ranked 30th among the specific diseases causing burden in 2023, accounting for 0.9% of total burden and 1.5% of all fatal burden. The burden from COVID‑19 was predominantly fatal (83%).
Australians living longer but little change in the proportion of life spent in full health
Australians are, on average, living longer and spending more years in full health (meaning no disease or injury). Years lived in full health is also referred to as the health-adjusted life expectancy (HALE).
Males and females born in 2023 could expect to live an average of 88% and 87% of their lives in full health respectively (71.6 years of the 81.3 years of average life expectancy for males and 73.6 years of the 85.1 years of average life expectancy for females).
However, years lived in ill health are also increasing, resulting in little change in the proportion of life spent in full health between 2003 and 2023.
National Preventive Health Strategy 2021–30: burden of disease targets
The National Preventive Health Strategy 2021–30 (the ‘Strategy’) outlines the long-term approach to prevention in Australia. The Strategy aims to address the wider determinants of health, promote health equity and decrease the overall burden of disease through a whole-of-systems approach to prevention (Department of Health 2021).
There are 6 burden of disease specific targets in the Strategy and data from the ABDS 2023 can be used to monitor 3 of the 6 targets.
Table 1.2 shows how the burden of disease measures in 2023 compare with the baseline measures (the year 2018) for each reportable target. Between 2018 and 2023, there has been little change in the proportion of the first 25 years and 0–4 years lived in full health (ranging between 91 and 92%). There has also been little change in the average number of years lived in full health (approximately 72 years for males and 74 years for females).
| Aim | Target | Sex | 2018 (baseline) | 2023 estimate | Comparison to 2018 |
|---|---|---|---|---|---|
All Australians have the best start in life | The proportion of the first 25 years lived in full health will increase by at least 2 percentage points by 2030 | Persons | 92.1% of first 25 years were lived in full health | 91.6% of first 25 years were lived in full health | –0.5(a) |
All Australians have the best start in life | The proportion of the first 0–4 years of life lived in full health will increase by at least 3.5 percentage points by 2030 | Persons | 92.0% of first 5 years were lived in full health | 91.4% of first 5 years were lived in full health | –0.6(a) |
All Australians live in good health and wellbeing for as long as possible | Australians have at least an additional 2 years of life lived in full health by 2030 | Males
Females | 71.5 years lived in full health
74.0 years lived in full health | 71.6 years lived in full health
73.6 years lived in full health | 0.1 years
-0.4 years |
(a) This is the difference in the proportion of the first 25 or 5 years lived in full health between 2023 and the baseline (2018).
Source: AIHW Australian Burden of Disease Database.
Estimates for 2023 are projections so progress against the targets may change as 2023 data becomes available. COVID‑19’s impacts on burden and the health of the Australian population may affect progress against these targets.
Where do I go for more information?
ABDS 2018 – interactive data visualisations
For more information on the burden of disease in Australia, see the following interactive data visualisations from ABDS 2018:
- State and territory estimates
- Remoteness areas
- Socioeconomic groups
- Risk factor burden
- Disease burden among Aboriginal and Torres Strait Islander people
- Risk factor burden among Aboriginal and Torres Strait Islander people.