Diet
Web article
Last updated:
Topic: Food & nutrition
Citation
AIHW
Australian Institute of Health and Welfare (2023) Diet, AIHW, Australian Government, accessed 20 April 2024.
APA
Australian Institute of Health and Welfare. (2023). Diet. Retrieved from https://pp.aihw.gov.au/reports/food-nutrition/diet
MLA
Diet. Australian Institute of Health and Welfare, 19 May 2023, https://pp.aihw.gov.au/reports/food-nutrition/diet
Vancouver
Australian Institute of Health and Welfare. Diet [Internet]. Canberra: Australian Institute of Health and Welfare, 2023 [cited 2024 Apr. 20]. Available from: https://pp.aihw.gov.au/reports/food-nutrition/diet
Harvard
Australian Institute of Health and Welfare (AIHW) 2023, Diet, viewed 20 April 2024, https://pp.aihw.gov.au/reports/food-nutrition/diet
Get citations as an Endnote file: Endnote
Diet
is an Australia's health
topic
On this page
The food and beverages we eat and drink (our diet) play an important role in our overall health and wellbeing. Food provides energy, nutrients and other components that, if provided in insufficient or excess amounts can result in ill health. The conditions often affected by our diet include coronary heart disease, stroke, high blood pressure, some forms of cancer, type 2 diabetes, dental caries and nutritional anaemias.
What should Australians eat?
The Australian Dietary Guidelines (ADG) (NHMRC 2013b), provide advice on healthy eating habits to promote overall health and wellbeing, reduce the risk of diet related diseases and protect against chronic conditions. They recommend Australians eat a wide variety of nutritious foods from the 5 food groups every day. Essential nutrients for good health are found in varying amounts throughout many different food groups. Variety in the diet maximises the possibility of obtaining enough of these essential nutrients.
The ADG recommend adults, adolescents and children enjoy a wide variety of nutritious foods from the 5 food groups every day:
- plenty of vegetables, including different types and colours and legumes/beans.
- fruit.
- grain (cereal) foods, mostly wholegrain and/or high fibre varieties, such as breads, cereals, rice, pasta, noodles, polenta, couscous, oats, quinoa and barley.
- lean meats and alternatives and poultry, fish, eggs, tofu, nuts, seeds and legumes/beans.
- dairy, including milk, yoghurt, cheese and/or their alternatives, mostly reduced fat (reduced fat milks are not suitable for children under 2).
- drink plenty of water.
Discretionary foods are foods that are not needed to meet nutrient requirements and do not fit into the 5 food groups. They are high in kilojoules, saturated fat, sodium (such as salt), added sugars and alcohol (NHMRC 2013b). The ADG recommend that discretionary foods should be consumed occasionally and in small amounts.
The ADG also provide advice on the number of serves of each food group that Australians should eat each day. Different amounts are recommended for people of different ages, sex, life stages, height and physical activity level.
This page focusses on whether or not Australians have met the minimum recommended number of serves of fruit and vegetable per day. Those reported as not meeting the guidelines are defined as not having met the minimum recommended number of serves per day. For more information on the recommended servings of fruit and vegetables, please see Tables 6 and 7 in the Technical notes.
For more information on the dietary guidelines for other food groups, see the Australian Dietary Guidelines.
Do Australians meet the dietary guidelines?
Data considerations
This section includes dietary information about the Australian population using the following surveys:
- the Australian Bureau of Statistics’ (ABS) 2020–21 National Health Survey (NHS). In this survey, participants are asked about their fruit and vegetable intake and their sugar sweetened drink consumption using short questions, such as ‘How many serves of fruit do you usually eat each day?’ (ABS 2022f). The 2020–21 NHS is used to report on dietary data at the national level only.
- the ABS 2017–18 National Health Survey (NHS). In this survey, participants are asked about their fruit and vegetable intake and their sugar sweetened drink consumption using short questions similar to the 2020–21 NHS (ABS 2019b). The 2017–18 NHS is used to report on variation by population and changes in fruit and vegetable intake across time.
- the ABS 2011–12 National Nutrition and Physical Activity Survey (NNPAS). In this survey, participants were asked about all the foods and drinks they consumed in the day before they were surveyed, using a method known as 24-hour dietary recall (ABS 2013).
There are strengths and limitations to the information from each survey. While the 2011–12 information provides a more comprehensive view of Australians’ dietary behaviours, the 2017–18 and 2020–21 NHS are more recent. As part of the upcoming ABS’s Intergenerational Health and Mental Health Study, the NNPAS is scheduled to be conducted again in 2023.
For more information, please refer to the Technical notes.
AIHW report Nutrition across the life stages explored whether Australians were meeting the dietary guidelines, and how results differ across the life stages found Australians of all ages generally (AIHW 2018):
- do not eat enough of the 5 food groups – vegetables, fruit, grains, meat and alternatives, and dairy products and alternatives.
- eat too much food that is high in energy and low in nutrients (‘discretionary food’).
- eat too much sugar, saturated fat, and sodium.
5 core food groups by age
In 2011–12, most Australians did not consume the recommended number of serves from the 5 food groups (Tables 1–4) (AIHW 2018):
- Low vegetable intake occurs in all age groups, with the average daily intake well below the recommended number of serves.
- Children aged 2–8 generally consume the recommended serves of fruit, while those aged 9–18 did not. Adults of all ages also did not consume the recommended number of serves of fruit.
- Only boys aged 4–11 and girls aged 9–11 met the recommended numbers of serves of grain. For adults aged 19 and over, only women aged 71 and over met the recommended number of serves of grain. Only 24% of women and 33% of men eat the recommended serves of grains.
- Adherence to the recommended serves of meat and alternatives decreases from ages 2–3 to 12–13, before increasing slightly with age but insufficient intake remains high across age group. For adults aged 19 and over, only 13% of women and 21% of men eat the recommended number of serves of meat and alternatives.
- Intake of dairy products and alternatives for the younger population meets or approaches the recommended serves, but reduces substantially from age 9–13, with more than 80% of the population not eating enough dairy serves in 2011–12.
Discretionary foods by age
In 2011–12, discretionary foods account for (AIHW 2018):
- 29% of energy intake for boys and 32% for girls aged 2–3 (approximately 3 serves of discretionary foods per day).
- 41% of energy intake for boys and girls at age 14–18 (approximately 6 to 8 serves of discretionary foods per day).
- Among adults, daily energy intake from discretionary foods ranged from 33% to 36% – between 5 to 7 serves per day on average. For adults aged 51–70, alcoholic drinks account for more than one-fifth (22%) of discretionary food intake (Tables 1–4).
High intake of discretionary foods is at the expense of more nutritious foods from the 5 food groups and may contribute to Australians exceeding the recommended intakes of saturated fats, sugars and sodium.
Age group (years) | Vegetables | Fruit | Grains | Dairy | Meat |
|---|---|---|---|---|---|
2–3 | ✖ | ✔ | ✖ | ✔ | ✖ |
4–8 | ✖ | ✔ | ✔ | ✖ | ✖ |
9–13 | ✖ | ✖ | ✔ (9-11yrs) ✖ (12-13yrs) | ✖ | ✖ |
14–18 | ✖ | ✖ | ✖ | ✖ | ✖ |
19–30 | ✖ | ✖ | ✖ | ✖ | ✖ |
31–50 | ✖ | ✖ | ✖ | ✖ | ✖ |
51–70 | ✖ | ✖ | ✖ | ✖ | ✖ |
71+ | ✖ | ✖ | ✖ | ✖ | ✖ |
✖ average daily intake did not meet recommended serves ✔ average daily intake met recommended serves
Source: AIHW 2018.
Age group (years) | Vegetable | Fruit | Grains | Dairy | Meat |
|---|---|---|---|---|---|
2–3 | ✖ | ✔ | ✖ | ✔ | ✖ |
4–8 | ✖ | ✔ | ✖ | ✖ | ✖ |
9–13 | ✖ | ✖ | ✔ (9-11yrs) ✖ (12-13yrs) | ✖ | ✖ |
14–18 | ✖ | ✖ | ✖ | ✖ | ✖ |
19–30 | ✖ | ✖ | ✖ | ✖ | ✖ |
31–50 | ✖ | ✖ | ✖ | ✖ | ✖ |
51–70 | ✖ | ✖ | ✖ | ✖ | ✖ |
71+ | ✖ | ✖ | ✔ | ✖ | ✖ |
✖ average daily intake did not meet recommended serves ✔ average daily intake met recommended serves
Source: AIHW 2018.
Age group (years) | Discretionary foods – proportion (%) of total energy1 | Added sugars – proportion (%) of total energy1 | Saturated and trans fats – proportion (%) of total energy2 | Sodium – mean intake as a proportion (%) of the adequate intake level (upper end of range)3 |
|---|---|---|---|---|
2–3 | 29 | 8.4 | 14 | 379 |
4–8 | 39 | 11 | 14 | 373 |
9–13 | 39 | 11 | 14 | 332 |
14–18 | 41 | 13 | 13 | 339 |
19–30 | 36 | 11 | 15 | 339 |
31–50 | 37 | 9.4 | 12 | 317 |
51–70 | 35 | 7.8 | 12 | 273 |
71+ | 36 | 8.5 | 12 | 241 |
Notes:
- Broad recommendation for discretionary foods and added sugar is to limit intake.
- Recommended less than 10% from saturated and trans fats for ages 14 and over.
- Sodium intake is measured as mg/day and is compared to the adequate intake level which varies by age group.
Source: AIHW 2018.
Age group (years) | Discretionary foods – proportion (%) of total energy1 | Added sugars – proportion (%) of total energy1 | Saturated and trans fats – proportion (%) of total energy2 | Sodium – mean intake as a proportion (%) of the adequate intake level (upper end of range)2 |
|---|---|---|---|---|
2–3 | 32 | 8.1 | 14 | 362 |
4–8 | 36 | 11 | 13 | 311 |
9–13 | 40 | 12 | 14 | 283 |
14–18 | 41 | 12 | 14 | 261 |
19–30 | 35 | 11 | 13 | 250 |
31–50 | 33 | 8.9 | 12 | 234 |
51–70 | 31 | 7.7 | 12 | 241 |
71+ | 32 | 8.0 | 12 | 193 |
Notes:
- Broad recommendation for discretionary foods and added sugar is to limit intake.
- Recommended less than 10% from saturated and trans fats for ages 14 and over.
- Sodium intake is measured as mg/day and is compared to the adequate intake level which varies by age group.
Source: AIHW 2018.
For more information, see Nutrition across the life stages.
Fruit and vegetable consumption
This section uses the latest self–reported data from the 2020–21 NHS. This survey was conducted during the COVID-19 pandemic which significantly changed the data collection method from face-to-face interviews to online, self-completed forms. This impacted response rates and the sample representativeness for some sub-populations.
The 2020–21 NHS should be considered a break in time series from previous NHS collections and used for point-in-time national analysis only. The data should not be compared to previous NHS data on dietary behaviour.
For further information, refer to the Technical notes.
Children
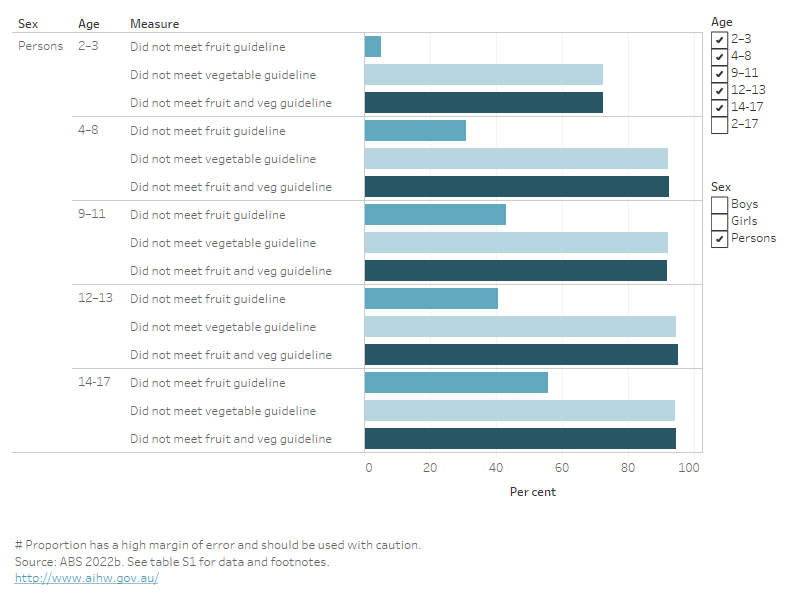
Based on the latest available from the 2020–21 NHS, for children aged 2−17, it is estimated that (ABS 2022b) (Figure 1):
- 37% do not meet the recommendations for daily fruit consumption.
- 90% do not meet the recommendations for daily vegetable consumption.
- 91% do not meet the recommendations for daily fruit and vegetable consumption.
- 5.3% do not eat any fruits and 4.1% do not eat any vegetables.
The proportion of children who do not meet the recommendations for daily fruit and vegetable consumption increase as age increases. Noting the amount of fruit and vegetable required to meet the guidelines also increases with age. Comparing children in the youngest age group (2–3 years) with children in the oldest age group (14–7 years) (Figure 1):
- 5.3% do not meet the recommendations for daily fruit consumption compared to 56%, respectively.
- 73% do not meet the recommendations for daily vegetable consumption compared to 94%, respectively.
- 73% do not meet the recommendations for daily fruit and vegetable consumption compared to 95%, respectively.
There are no differences in the proportion of boys and girls aged 2–17 who met the recommended fruit guidelines. Girls aged 2–17 are slightly more likely than boys to meet the recommended vegetable guidelines (11% compared with 7.3%) (ABS 2022b).
Figure 1: Proportion of children aged 2–17 who do not meet the recommendations for daily fruit and vegetable consumption, by age group, 2020–21
By selecting the relevant age group or gender, this bar chart will show the proportion of children not meeting the dietary guidelines. Generally, children of all ages do not eat enough fruit and vegetables, and particularly nearly all children aged over 4 years do not enough vegetables.
Adults
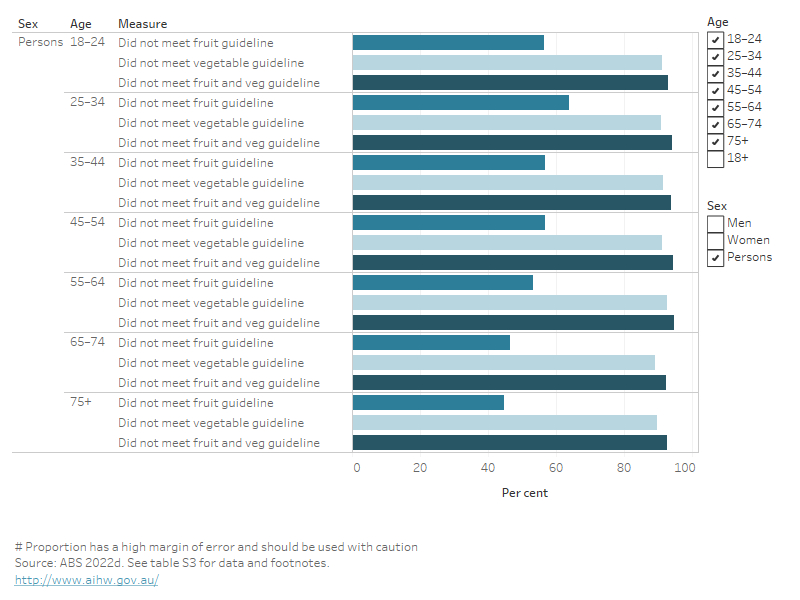
Most adults do not meet the recommendations for fruit and vegetable consumption. Based on the latest available data from the 2020–21 NHS, for adults aged 18 and over, it is estimated that (ABS 2022d):
- 55% do not meet the recommendations for daily fruit consumption.
- 91% do not meet the recommendations for daily vegetable consumption.
- 94% do not meet the recommendations for daily fruit and vegetable consumption.
- There were also 12% who did not eat any fruits and 1.6% did not eat any vegetables.
The proportions of adults who do not meet the daily vegetable consumption are similar across age groups. The proportions of adults who do not meet the daily fruit consumption are higher among young people: 57% of those aged 18–24 do not meet the recommendations for daily fruit consumption compared with 45% of people aged 75 and over (Figure 2).
Men aged 18 years and over are less likely than women to meet the recommendations for daily fruit and vegetable consumption (ABS 2022d):
- 59% of men do not meet the recommendations for daily fruit consumption compared with 52% of women.
- 96% of men do not meet the recommendations for daily vegetable consumption compared with 87% of women (Figure 2).
Figure 2: Proportion of adults aged 18 and over who do not meet the recommendations for daily fruit and vegetable consumption, 2020–21
This interactive bar chart shows that regardless of gender, nearly all adults do not eat enough vegetables, and about half do not eat enough fruit.
Sugar-sweetened drinks
The Australian Dietary Guidelines recommend limiting intakes of drinks high in added sugars, as they can provide excess kilojoules with little nutritional value and can increase the risk of excessive weight gain (NHMRC 2013b).
Based on the latest available data, for children aged 2–17 (ABS 2022b):
- nearly 8 in 10 (79%) do not consume any sugar sweetened drinks and 90% do not consume any diet drinks.
- 3.4% consumed sugar-sweetened drinks daily and 1.2% consumed diet drinks daily.
- an average of 2.1 cups of sugar sweetened drinks are consumed per day (1 cup is 250 mL) by those who are daily consumers of sugar sweetened drinks.
- the daily average number of cups of diet drinks consumed is also 2.1 cups for daily consumers of diet drinks.
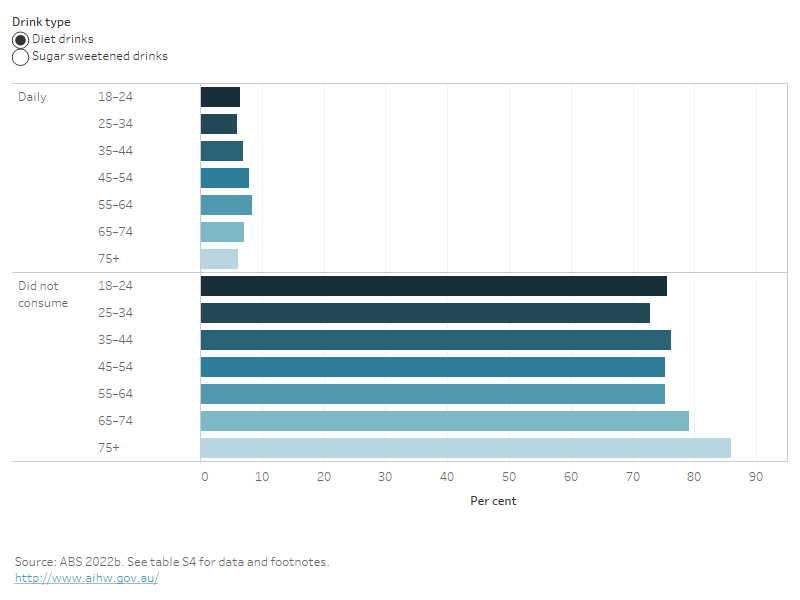
Based on the latest available data, for adults aged 18 years and over (ABS 2022d):
- 6.4% consumed sugar-sweetened drinks daily and 7.1% consumed diet drinks daily.
- 60% did not usually consume either sugar-sweetened or diet drinks.
- an average of 2.9 cups of sugar sweetened drinks are consumed per day (1 cup is 250 mL) by those who are daily consumers of sugar sweetened drinks. This is lower than the average for diet drinks (3.2 cups).
- a greater proportion of men consumed both sugar-sweetened drinks and diet drinks than women – 8.5% of men consumed sugar-sweetened drinks daily compared to 4.5% of women; 8.0% of men consumed diet drinks daily compared to 6.1% of women.
- Sugar-sweetened drinks consumption decreased as age increased, while it varies for diet drinks for those that consume drinks daily, every 1–3 days or 4–6 days (Figure 3 and Table S4).
Figure 3: Proportion of adults aged 18 and over who consume sugar sweetened drinks and diet drinks, 2020–21
This bar chart shows that across adult age groups, most adults do not consume sugar sweetened or diet drinks, however sugar sweetened drinks are consumed more on a daily basis by younger age groups.
How do dietary patterns vary by population groups?
See Determinants of health for Indigenous Australians for information on diet among Aboriginal and Torres Strait Islander people.
Remoteness area
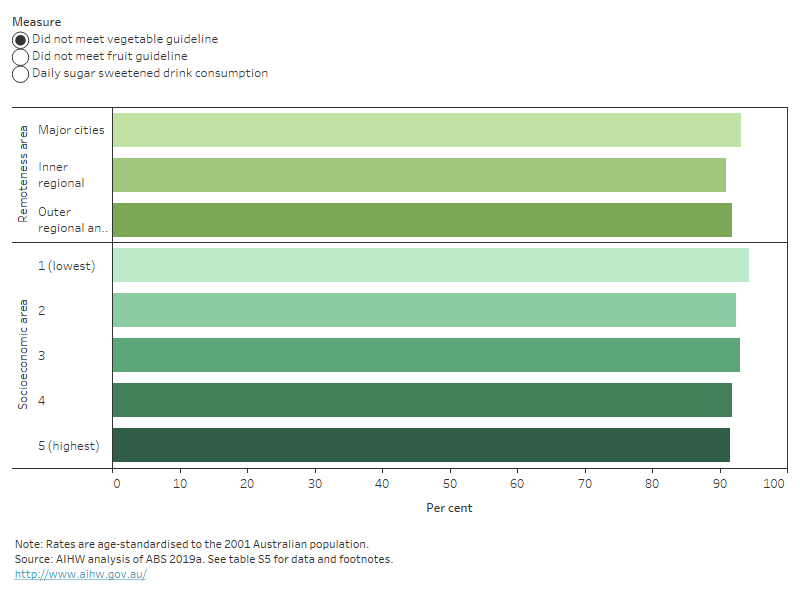
In 2017–18, after adjusting for age differences, a greater proportion of Australians aged 18 and over living in Outer regional and remote areas (53%) did not meet the daily fruit recommendation compared with those living in Major cities (48%) (Figure 4). The proportions not eating the vegetable recommendation were similar for adults living in Outer regional and remote areas (92%) and those living in Major cities (93%) (AIHW analysis of ABS 2019a).
In 2017–18, after adjusting for age differences , Australians aged 18 and over living in Outer regional and remote areas were more likely to consume sugar sweetened drinks daily (14%) than those living in Major cities (8.3%) (AIHW analysis of ABS 2019a).
Socioeconomic area
In 2017–18, after adjusting for age differences, Australians aged 18 and over living in the lowest socioeconomic areas were less likely to meet the fruit and vegetable recommendations than those living in the highest socioeconomic areas, although the differences were not large:
- 53% of those living in the lowest socioeconomic areas didn’t meet the fruit recommendation, compared with 46% in the highest areas.
- 94% of those living in the lowest socioeconomic areas didn’t meet the vegetable recommendation, compared with 92% in the highest areas (AIHW analysis of ABS 2019a).
Australian adults living in the lowest socioeconomic areas were 3 times as likely to drink sugar sweetened drinks daily (15%) as those living in the highest socioeconomic areas (4.4%) in 2017–18, after adjusting for age differences (AIHW analysis of ABS 2019a).
Figure 4: Proportion of adults aged 18 and over not meeting the daily fruit and vegetable recommendations, and who consume daily sugar-sweetened drinks, by selected population characteristics, 2017–18.
Figure 4: Proportion of adults aged 18 and over not meeting the daily fruit and vegetable recommendations, and who consume daily sugar-sweetened drinks.
This bar chart shows that variation in dietary behaviour by remoteness and socioeconomic areas. More adults aged 18 and over living in Outer regional and remote areas did not meet the daily fruit recommendations compared with those living in the Major cities. Those living in Outer regional and remote areas were also more likely than those living in Major cities to consume sugar sweetened drinks daily. Compared with adults living in the highest socioeconomic areas, more adults living in the lowest socioeconomic areas did not meet the fruit and vegetable recommendations, and were also more likely to drink sugar sweetened drinks daily.
How do dietary patterns change across time?
Trends in fruit and vegetable consumption
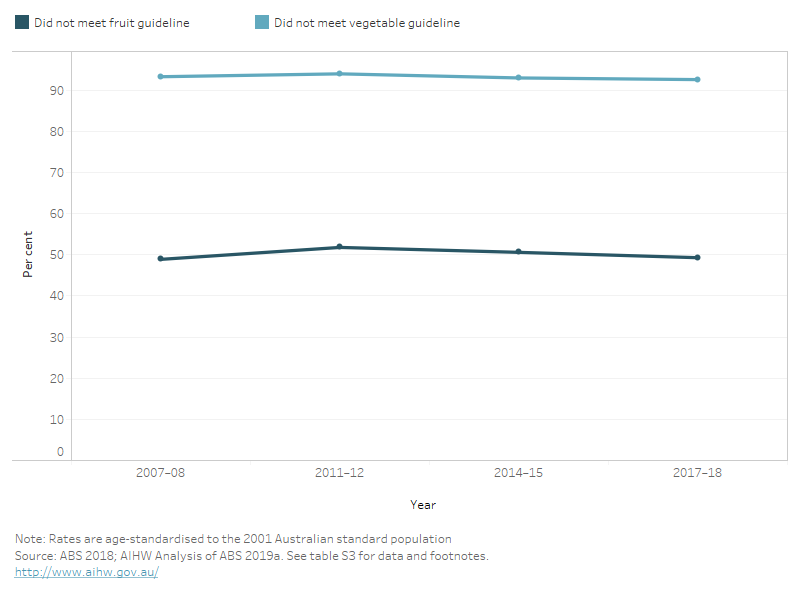
Using the latest available data for trends, fruit and vegetable consumption is also able to be measured over time. Between 2007–08 and 2017–18, the proportion of adults aged 18 and over not meeting the fruit and vegetable guidelines remained about the same, approximately 49–52% of people did not meet the fruit guidelines, and approximately 93–94% did not meet the vegetable guidelines (ABS 2018, ABS 2019a) (Figure 5).
Figure 5: Trend in the prevalence of inadequate fruit and vegetable intake for persons aged 18 and over, 2007–08 to 2017–18
This interactive line graph shows that between the time periods of 2007–08 to 2017–18, that for all adults there has been little change in fruit and vegetable intake.
What are the health impacts of dietary risks?
Burden of disease is a measure of the years of healthy life lost from living with ill health or dying prematurely from disease and injury. A portion of this burden is due to modifiable risk factors. Burden of disease analysis estimates the contribution of these risk factors to this burden.
Dietary risk factors were the 3rd leading risk factor contributing to ill health and premature deaths after tobacco use, and overweight and obesity in Australia, in 2018 (AIHW 2021). Dietary risks factors include components where adequate amounts in the diet are required to prevent disease, as well as diets where excessive consumption contributes to disease development. The 12 individual dietary risk factors were:
- a diet low in: fruit and vegetables, milk, nuts and seeds, whole grains and high fibre cereals, legumes, polyunsaturated fat, and fish and seafood
- a diet high in: sodium, sugar-sweetened beverages, and red and processed meats.
Dietary risk factors combined were the 4th leading risk factor contributing to deaths – 15,802 deaths (9.9% of total deaths) in 2018 (AIHW 2021).
Dietary risk factors were linked to 16 diseases and contributed to:
- 50% of coronary heart disease total burden.
- 26% of bowel cancer burden.
- 26% of type 2 diabetes burden.
- 26% of stroke burden (AIHW 2021).
Males experience a greater amount of disease burden due to dietary risks factors than females in all ages up to age 84 (AIHW 2021). Total disease burden attributable to dietary risk factors is twice as high in the lowest (most disadvantaged) socioeconomic areas compared with the highest areas (least disadvantaged).
For more information on the disease burden due to dietary risks, see the Australian Burden of Disease Study 2018: Interactive data on risk factor burden.
What food is purchased from the food retail sector?
The overall food and non-alcoholic drinks purchased from the food retail sector can be monitored over time to see how this profile changes. It represents foodstuff available for people to consume and does not account for foods that have been stored, wasted or not consumed (ABS 2022a). The measure is known as apparent food consumption.
The estimates include food and non-alcoholic drinks purchased from (ABS 2022a):
- Major supermarkets and fresh food markets.
- Convenience stores.
- Butchers and seafood shops.
- Bakeries and delis.
It does not include food purchases from fast food outlets, cafes and restaurants, and does not include foods that were obtained from foraging, hunting or fishing.
It is not possible using these data to determine the consumption patterns of individuals or groups such as consumption by age (ABS 2022a).
For further information, refer to the Apparent Consumption of Selected Foodstuffs, Australia methodology and the Technical notes.
Apparent consumption of the 5 food groups
Between 2018–19 to 2020–21, the number of serves available per person from food purchased (apparent consumption) of the 5 food groups (ABS 2022a):
- Remained the same for fruit, dairy and alternatives and lean meats and alternatives; with 1.4 serves, 1.6 serves and 1.8 serves, respectively, across all three years.
- Remained steady for vegetables from 2.3 in 2018–19 to 2.4 serves in 2019–20, remaining at 2.4 serves in 2020–21.
- Decreased for grains and cereals, from an average of 4.0 serves in 2019–20 to 3.8 serves in 2020–21. This was a return similar to 2018–19.
Grains and cereals
Grains and cereals purchased in Australia were from the food types:
- grains (such as rice) (38%).
- breads (28%).
- flour (17%).
- oats (11%).
- breakfast cereal flakes (5.3%).
The Australian Dietary Guidelines recommend eating mainly wholegrain or high fibre foods, rather than low fibre or highly refined foods (NHMRC 2013b). The apparent consumption of grains and cereals from wholegrain or high fibre was 33.7% in 2020–21, similar to 2019–20 (33.2%). This was a decrease from 34.8% in 2018–19 (ABS 2022a).
Apparent consumption of discretionary food
Discretionary foods contributed to 38.1% of the available dietary energy per person from food purchased. This is a slight increase from 37.6% in 2018–19 and 37.7% in 2019–20 (ABS 2022a).
The top 3 contributors to discretionary food apparent consumption were (ABS 2022a):
- Cereal based products (21%) such as sweet and savoury biscuits, cakes, muffins and pastries.
- Confectionary (16%) such as chocolates, fruit, nut and seed-bars, and muesli bars.
- Non-alcoholic beverages (9.1%) such as soft drinks, cordial, and fruit and vegetable juices.
Apparent consumption of free sugar (including added sugar), saturated fat, and sodium
Dietary energy available per person from free sugar (sugar added to foods and sugar naturally present in juice and honey) and saturated fat in foods purchased are both higher than the recommended dietary intake for these nutrients, in 2020–21 (Table 5). The amount of sodium available per person (3,125 mg) from foods purchased is 56% higher than the recommended intake (Table 5) (ABS 2022a).
Of dietary energy available per person from food sold:
- Around 12% is from free sugar. Of the free sugar, 92% was added sugar (added to foods during processing and preparation).
- 15% is from saturated fat and 0.7% came from trans fatty acids. Discretionary and non-discretionary foods each contributed around half of the available saturated fat.
| Per person apparent consumption daily | % total dietary energy | Recommended intake | % that came from discretionary foods |
|---|---|---|---|---|
Free sugar1 Added sugar | 68.8 g 63.6 g
| 12.4 11.5 | <10% of total energy intake2 | 88.7 |
Saturated fat Trans fatty acid | 36.4 g
1,659.2 mg | 15.2
0.7 | <10% of energy intake3 | 49.0 |
Sodium | 3,125 mg4 | n/a | 2,000 mg per day5 | 58.3 |
Notes:
- Sugars naturally present in unrefined foods such as fruit and unflavoured milk are not considered free sugar.
- Recommendation from the World Health Organisation (WHO).
- Recommendation from the Nutrient Reference Values for Australia and New Zealand (NRVs).
- The apparent consumption of sodium does not take into account foods purchased from fast food outlets, takeaway and restaurants. Additionally, the proportion of salt purchased for non-food uses is not known so apparent consumption of sodium from sales of salt may be an overestimation (ref: ABS).
- The Suggested Dietary Target (SDT) recommends 2000 mg/day of sodium which is also consistent with the 2012 WHO guideline for sodium consumption which recommends less than 2000 mg/day for adults.
For more information, see the ABS Apparent Consumption of Selected Foodstuffs.
Impacts of COVID-19 on diet
Data are showing how public health measures put in place during the early stage of COVID-19 (for example, quarantine, the closure of non-essential services and restrictions on venue capacity) have impacted Australians’ dietary habits, as well as food purchasing behaviours.
Following the introduction of COVID-19 restrictions in March 2020, the response by Australian households to the highly uncertain circumstances was an increase in purchasing of household supplies from supermarkets (ABS 2022a). There was a greater weight of foods purchased in March 2020. Mean daily serves per person available increased most notably for grains in that month (ABS 2022a).
Some changes in dietary behaviour are observed in the first few months of lockdowns from April to June 2020, as seen in the data from the ABS Household Impacts of COVID-19:
- 29% of participants reported consuming less take-away and delivered meals in late April/early May 2020.
- 38% reported more cooking and baking in late April/early May 2020.
- Nearly 3 in 10 females (28%) and around 1 in 6 males (16%) reported eating more snack foods (for example, chips, lollies, biscuits), in June 2020, than what was usual prior to the implementation of public health measures in March 2020.
- In contrast, almost 2 in 10 (20%) people aged 18–64 reported that they reduced their consumption of soft drinks, cordials and energy drinks during the same time period (ABS 2022e).
Opportunity-induced eating and coping with negative emotions (such as stress) might also have an impact on unhealthy snacking behaviour (Verhoeven, et al. 2015). A study of poor appetite and overeating in 13, 829 Australian adults during the first month of COVID-19 restriction measures found that 54% were bothered by poor appetite or overeating. Over 1 in 10 (12%) reported poor appetite or overeating nearly every day (Owen, et al. 2020).
Where do I go for more information?
For more information on diet, see:
- Nutrition across the life stages
- Australian Burden of Disease Study 2018: Interactive data on risk factor burden
Visit Food & nutrition to see more on this topic.
Technical notes
About the Australian Bureau of Statistics National Health Surveys
This web report uses data from the following surveys from the Australian Bureau of Statistics:
- ABS 2011–12 National Nutrition and Physical activity Survey.
- ABS 2017–18 National Health Survey (NHS).
- ABS 2020–21 NHS.
- Apparent consumption of Selected Foodstuff.
The NHS is a series of surveys designed to collect a range of information about the health of Australians, including:
- prevalence of long-term health conditions.
- health risk factors such as smoking, fruit and vegetable consumption, alcohol consumption and exercise.
- use of health services such as consultations with health practitioners and actions people have recently taken for their health.
- demographic and socioeconomic characteristics.
The most recent 2020–21 NHS was conducted from August 2020 to June 2021. As it was conducted during the COVID-19 pandemic, to ensure the safety of interviewers and respondents, the survey was collected via online, self-completed forms (previous iterations of the NHS was conducted via face-to-face interviews).
Non-response is usually reduced through interviewer follow-up of households who have not responded. As this was not possible during lockdown periods, there were lower response rates than previous NHS cycles, which impacted sample representativeness for some sub-populations.
Additionally, the impact of COVID-19 and lockdowns might also have had direct or indirect impacts on people’s usual behaviour over the 2020–21 period. Due to these impacts and changes, the 2020–21 NHS is considered a break in series and should only be used for point-in-time analysis only. Comparisons with previous diet data over time are not recommended. Data on variations by populations groups and trends in dietary behaviour across time are presented up to 2017–18 only.
For more information, please refer to the ABS National Health Survey: First results methodology.
About the ABS Apparent Consumption of Selected Foodstuff
The primary data source used is the aggregated scanner data (SD) provided to the ABS from major supermarkets. The aggregated data are based on information compiled from barcode scanning at the point of sale. The major supermarkets that provide data to the ABS account for an estimated 82% of Food Retail sector.
The Household Expenditure Survey (HES) is undertaken every six years, with the most recent survey in 2015–16. The 2015–16 HES is used to help estimate and impute the value of purchases made at stores other than the major supermarkets in the SD.
For further information, refer to the Apparent Consumption of Selected Foodstuffs, Australia methodology.
Recommended number of serves of vegetable and fruit per day
Tables 6 and 7 summarise the minimum recommended number of serves of vegetable and fruit per day, by different age groups.
For more information on the dietary guidelines for other food groups, see the Australian Dietary Guidelines.
Age Group (years) | Male | Female |
|---|---|---|
2–3 | 2.5 | 2.5 |
4–8 | 4.5 | 4.5 |
9–11 | 5 | 5 |
12–13 | 5.5 | 5 |
14–18 | 5.5 | 5 |
19–50 | 6 | 5 |
51–70 | 5.5 | 5 |
70+ | 5 | 5 |
Source: NHMRC 2013a.
Age Group (years) | Male | Female |
|---|---|---|
2–3 | 1 | 1 |
4–8 | 1.5 | 1.5 |
9–11 | 2 | 2 |
12–13 | 2 | 2 |
14–18 | 2 | 2 |
19–50 | 2 | 2 |
51–70 | 2 | 2 |
70+ | 2 | 2 |
Source: NHMRC 2013a.
ABS (2013) Australian Health Survey: user's guide, 2011-13, abs.gov.au, accessed 7 January 2022.
ABS (2018) National Health Survey: First Results, abs.gov.au, accessed 28 March 2023.
ABS (2019a) Microdata: National Health Survey, 2017–18, AIHW analysis of detailed microdata, abs.gov.au, accessed 12 February 2019.
ABS (2019b) National Health Survey: Users' Guide, 2017-18, abs.gov.au, accessed 28 March 2023.
ABS (2022a) Apparent Consumption of Selected Foodstuffs, Australia, abs.gov.au, accessed 28 November 2022.
ABS (2022b) Dietary behaviour, [Table 10: Children’s consumption of fruit, vegetables, and sugar sweetened and diet drinks], abs.gov.au, accessed 24 November 2022.
ABS (2022d) Dietary behaviour, [Table 9: Consumption of fruit, vegetables, and sugar sweetened and diet drinks], abs.gov.au, accessed 24 November 2022.
ABS (2022e) Household Impacts of COVID-19 Survey, April 2022, abs.gov.au, accessed 28 November 2022.
ABS (2022f) National Health Survey: First Results methodology, abs.gov.au, accessed 22 November 2022.
AIHW (Australian Institute of Health and Welfare) (2021) Australian Burden of Disease Study 2018: Interactive data on risk factor burden, AIHW website, accessed 17 October 2022.
NHMRC (National Health and Medical Research Council) (2013a) Australian Dietary Guidelines Providing the scientific evidence for healthier Australian diets, nhmrc.gov.au, accessed 28 November 2022.
NHMRC (2013b) Australian Dietary Guidelines Summary, nhmrc.gov.au, accessed 23 November 2022.
Owen A, Tran T, Hammarberg K, Kirkman M and Fisher JRW (2020) 'Poor appetite and overeating reported by adults in Australia during the coronavirus-19 disease pandemic: a population-based study', Public Health Nutrition, 24 2, 275-281, https://doi.org/10.1017/S1368980020003833.
Verhoeven A, Adriaanse MA, de Vet E, Fennis BM and de Ridder DTD (2015) 'It's my party and I eat if I want to. Reasons for unhealthy snacking', Appetite, 84 1, 20-27, doi.org/10.1016/j.appet.2014.09.013.
WHO (World Health Organisation) (2015) WHO calls on countries to reduce sugars intake among adults and children, www.who.int/health, accessed 28 November 2022.