Health expenditure is money spent on health goods and services. It includes money spent by all levels of governments as well as non-government entities such as individuals, private health insurers, and injury compensation insurers.

Health spending on goods and services includes:

  • hospitals (both public and private)
  • primary health care (unreferred medical services, dental services, other health practitioners, community health, public health, and medications)
  • referred medical services
  • other services (patient transport services, aids and appliances, and administration)
  • research
  • capital expenditure.

Health spending in 2021–22

Australia spent an estimated $241.3 billion on health goods and services in 2021–22 – an average of approximately $9,365 per person. The real growth (adjusted for inflation) in total health spending (recurrent and capital) was 6.0% more than in 2020–21. This was higher than the average yearly growth rate over the decade to 2021–22 (3.4%).

In 2021–22, health spending accounted for 10.5% of the gross domestic product (GDP) in Australia, approximately 0.2 percentage points lower than in 2020–21.

For more information, see Overview.

In 2021–22, governments funded $176.0 billion of the total health expenditure (72.9%) with non-government sources funding the remaining $65.3 billion (27.1%).

Spending by source of funds

Of the total government funding in 2021–22, the Australian Government contributed $105.8 billion, with state and territory governments contributing $70.2 billion. In 2021–22, non-government sources spent $65.3 billion on health, a 2.4% decrease in real terms compared to the previous year. Individuals contributed $33.7 billion, just over half (51.5%) of non-government health spending, private health insurance providers $17.5 billion (26.8%) and other non-government sources $14.2 billion (21.7%). 

For more information, see Spending trends by sources .

Areas of health spending

During 2021–22, the greatest increases in recurrent spending were for: 

  • primary health care, a $8.3 billion (10.9%) increase in real terms, which was associated with increased spending related to the pandemic, such as the COVID-19 vaccines, and personal protective equipment.
  • hospitals, a $4.2 billion (4.6%) increase in real terms. This growth in hospital spending was partially driven by an increase in hospitalisations involving a COVID-19 diagnosis.

For more information, see Spending trends by areas of spending.

Government COVID-19 health response

The pandemic impacted health spending in many ways, often through increasing the cost and complexity of service delivery in ways that are difficult to quantify. There were, however, some large COVID-19–specific response programs, such as the National Partnership on COVID-19 Response (NPCR) and spending on COVID-19–related programs by the Australian Government Department of Health and Aged Care. Over the period 2019–20 to 2021–22, there was an estimated $45.0 billion spent through these programs ($24.9 billion on the NPCR and $20 billion on the Department of Health and Aged Care programs) in current prices (see glossary).

Spending on the National Partnership on COVID-19 Response

During the first 2 years of the COVID-19 pandemic period (2019–20 to 2020–21), spending on the NPCR was estimated to be $12.1 billion in current prices ($4.5 billion 2019–20 and $7.7 billion in 2020–21). Please note that the pandemic only started about 4 months before the end of the 2019–20 financial year. In 2021–22, the spending through NPCR was estimated to be $12.8 billion ($6.6 billion by the Australian Government and $6.2 billion by state and territory governments) (Figure 1). The components of the Australian Government spending in 2021–22 were:

  • hospital services payments ($1.9 billion, or 28%)
  • state public health payments ($4.3 billion, or 65%)
  • private hospital financial viability payment ($0.4 billion, or 6.7%).

As part of the NPCR, state and territory governments also funded $1.9 billion on hospital services payments and $4.3 billion on state public health payments.

Figure 1: Health spending on the NPCR, current prices, 2019–20 to 2021–22

The bar chart shows spending on the National Partnership on COVID-19 Response (NPCR), funded by both Australian Government and state and territory governments over the period 2019–20 to 2021–22. In 2019–20, the Australian Government funded $2.4 billion while state and territory governments contributed $2.0 billion. In 2021–22, the Australian Government spending on the NPCR was $6.6 billion and state and territory governments funding was $6.2 billion.

Source: Administrator’s Jurisdictional Advisory Committee, NHFB (2023).

Australian Government spending on COVID-19 through Department of Health and Aged Care programs

Total Australian Government spending through specific COVID-19 Department of Health and Aged Care programs (outside the NPCR) up to 2021–22 was estimated to be $20 billion in current prices ($1.7 billion in 2019–20, $6.2 billion in 2020–21 and $12.1 billion in 2021–22) (Figure 2). 

The distribution of spending in 2021–22 included: 

  • 44% ($5.4 billion) on COVID-19 vaccinations (mainly provided access to, and delivery of, COVID-19 vaccines).
  • 31% ($3.8 billion) on COVID-19–related medical services (mainly related to COVID-19 vaccine suitability assessment services, as well as other referred and unreferred medical services through MBS-funded telehealth)
  • 9.2% ($1.1 billion) on COVID-19 testing (mainly through MBS-funded COVID-19 testing including rapid antigen tests)   
  • 8.4% ($1.0 billion) on COVID-19 medical goods and equipment (mainly related to distributions of masks and personal protective equipment products for the national medical stockpile)
  • 6.8% ($0.8 billion) on Other COVID-19–related health spending (largely related to mental health programs, communication programs for health protection and awareness, and public health mainly related to primary care respiratory clinics and crisis support)
  • 0.3% ($0.03 billion) on COVID-19–related investments.

Note that COVID-19–related spending for aged care is outside the scope of this page. This also does not include COVID-19–related spending by other Australian Government agencies, which might fall into a broader scheme of economic response to COVID-19. 

Figure 2: Australian Government spending on COVID-19 through Department of Health and Aged Care programs, by areas of spending, current prices, 2019–20 to 2021–22

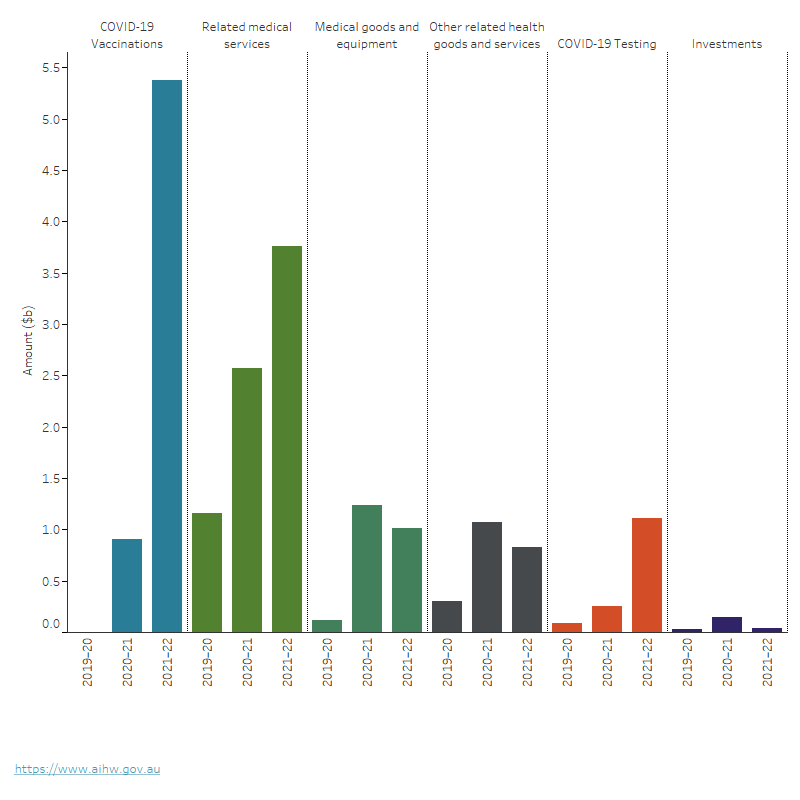
The bar chart shows Australian Government spending through Department of Health and Aged Care programs over the period 2019–20 to 2021–22. In 2019–20, Australian Government spending in response to the COVID-19 pandemic was estimated to $1.7 billion. It was estimated to be $12.1 billion in 2021–22. Of this, $3.8 billion spent on the COVID-19 related medical services, $1.0 billion on COVID-19 medical goods and equipment, $0.8 billion on Other COVID-19 related health spending, $5.38 billion on COVID-19 vaccination, $1.1 billion on COVID-19 testing and $0.03 billion on COVID-19 related investments.

Source: AIHW Health Expenditure Database.

Australia’s health spending ranking across OECD countries

Using the OECD-SHA, Australia’s health spending (excluding spending by providers of residential aged care facilities) to GDP ratios ranged between 8.5% and 8.8% from 2011 to 2013 (Figure 3). Then, Australia’s residential aged care expenditure was reported in OECD Health expenditure in the period 2014 to 2021. As a result, these ratios of health spending to GDP shifted up between 9.8% and 10.1% from 2014 to 2018 before increasing to 10.7% in 2020 during the COVID-19 pandemic period.

In 2021, Australia’s health spending to GDP ratio ranked 15th with a ratio of 10.5% compared with the OECD median of 9.7%, among 38 OECD member countries. 

Figure 3: Health spending to GDP ratios and Australia’s rank among OECD countries, current prices and local currencies, 2011 to 2021

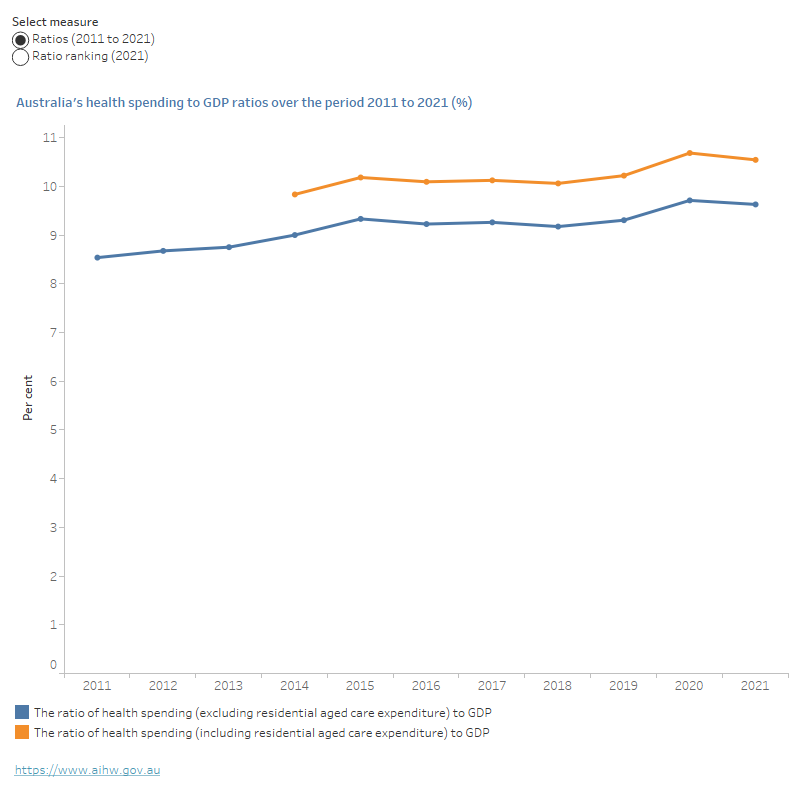
The line chart shows that Australia’s health spending to GDP ratio from 2011 to 2021 in two cases: health spending including or excluding residential aged care expenditure. The ratios increased steadily over the period 2011 to 2021. 

The bar chart shows that in 2021 health spending as a proportion of GDP was highest in the United States at 17.4% and Germany at 12.9%. The lowest ratio was in Luxembourg at 5.7% and Turkey at 4.6%. Australia’s health spending as a proportion of GDP of 10.5% was the 15th highest among OECD countries and 0.8 percentage point higher than the OECD median.

Notes

  1. Australia’s health spending figure in 2021 was preliminary estimated by AIHW. Then, the figure may be different with the one published by OECD. 
  2. Due to difference in the scope and methodology, Australia’s health spending figures in international comparisons are not comparable with data in Health expenditure Australia report.
  3. Due to the data revisions from some OECD member countries, these ratios and rankings for OECD countries are not comparable to the previous reports.
  4. Due to difference in reference year and methodology, these ratios are not comparable to Australia’s health expenditure: an international comparison (AIHW 2019)

Sources: AIHW Health Expenditure Database; OECD 2023.

Where do I go for more information?

For more information on health expenditure, see:

For more on this topic, visit Health & welfare expenditure.