Not faring so well
While most Australians are doing well, some groups continue to face disadvantages that can affect their mental and physical health, employment opportunities and general feelings of community engagement and belonging.
This section profiles challenges facing some people in the following groups: Indigenous Australians, homeless Australians, people with mental illness, people experiencing domestic and family violence, and people with disability.
Gaps in Indigenous education and employment
Even though outcomes for Indigenous people have improved in a number of key areas in recent years, there are still large gaps between average outcomes for Indigenous and other Australians, including in education, employment, household income and disability.
Indigenous children are less likely than non-Indigenous children to be enrolled in preschool, and are more likely to be developmentally vulnerable when starting primary school.
In 2012–13, just under half (48%) of Indigenous people aged 15–64 were employed, compared with 76% of the non-Indigenous working-age population.
However, between 2002 and 2012–13, the proportion of Indigenous 17–24 year olds who were in post-school education or training and/or were employed increased from 32% to 40%. This compares with a non-Indigenous rate of about 75% over the same period.
Indigenous adults relying less on government payments
For disadvantaged Australians, access to government income support is important to ensure their social and economic wellbeing.
Lower employment rates among Indigenous Australians lead to a higher proportion relying on a government payment as their main source of personal income.
In 2012–13, about 50% of Indigenous Australians (aged 18–64) said their main source of income was government payments. While this was more than 3 times the rate for non-Indigenous people (16%), the proportion was lower than the 63% in 2002.
The proportion of Indigenous 18–64 year olds who reported their main source of income was from employment increased from 32% in 2002 to 41% in 2012–13.
After including the income from government payments, the median weekly income for Indigenous households was $465 in 2012–13. This equates to just over half of the $869 median income that non-Indigenous households received (after adjusting for differences in household size and composition).Greater need for housing assistance for Indigenous Australians
Home ownership has improved for Indigenous Australians. The proportion of Indigenous adults living in a home owned or being bought by a member of their household rose from 22% in 1994 to 30% in 2012–13.
However, Indigenous Australians are still more likely to receive housing assistance than non-Indigenous Australians. In 2013, around 67,000 Indigenous households were receiving assistance through a range of social housing programs.
Overall, an estimated 43% to 46% of all Indigenous households received help from at least one major housing assistance program, compared with around 18% of other households.
More homeless people
Although almost anyone can find themselves at risk of homelessness, some people are more vulnerable than others, including Indigenous Australians; women and children fleeing domestic violence; and people with drug, alcohol or mental health issues.
On Census night 2011, just over 105,200 people in Australia were counted as being homeless, up from 89,700 in 2006.
Of these people, 25% were Indigenous Australians, 25% were aged 12–24 and 17% were under 12. The majority of those under 24 were in severely overcrowded households or supported accommodation for the homeless.
While some homeless people spent the night in short-term or emergency accommodation, others were sleeping in the open without shelter.
In 2013–14, about 254,000 people used specialist homelessness services—4% more than in 2012–13. About 57,500 young people aged 15-24 used specialist homelessness services, and about 44,400 of them were on their own when they sought help.
Mental illness linked with higher unemployment
It has been estimated that about 45% of Australians will experience a mental illness at some time in their lives.
In 2007, anxiety disorders were the most common (14%), followed by affective disorders such as depression (6%) and substance-use disorders such as alcohol dependence (5%).
People with a mental illness are more likely to be unemployed or on a low income or a government pension than people without mental illness, and are also at greater risk of being homeless. In 2007, the unemployment rate for people with a mental illness in the previous 12 months was higher than for people without a mental illness (4% and 2% respectively).
People with a mental illness in the previous 12 months were also more likely to report their main source of income as government pensions and allowances than people without a mental illness (26% and 22% respectively). About 8% of people with mental illness in the previous 12 months had a history of homelessness, compared with 2% of people without a mental illness.
Disability increases with age
In 2012, about 4.2 million Australians had a disability and, of those, about 43% relied on a government pension or benefit as their main source of income.
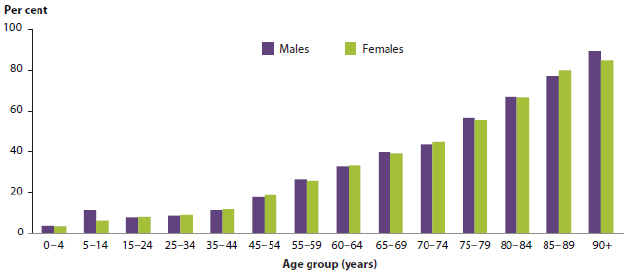
The proportion of the population with disability has remained stable over time at just under 19%. The likelihood of having a disability rises with age, ranging from 4% of those aged 0–4 to 86% of those aged 90 or over.
Of Australians who reported having a disability in 2012:
- 33% had a severe or profound core activity limitation (that is, they always or sometimes needed help with the day-to-day activities of self-care, mobility and/or communication)
- 15% had a moderate core activity limitation
- 33% had a mild core activity limitation.
People with disability may also have schooling or employment restrictions, or limitations in other activities such as cognitive or emotional tasks or health care.
Indigenous people are 1.7 times as likely as non-Indigenous people to have a disability, after adjusting for the fact that the Indigenous population is younger.
Proportion of the population with disability, by age group and sex, Australia, 2012
People with disability are less likely to have a job
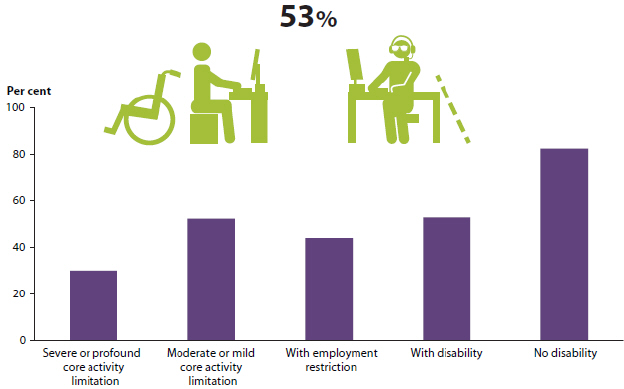
In 2012, the labour force participation rate of people with disability (aged 15–64) was 53%, compared with 83% of people without disability.
In 2012, the unemployment rate for people with disability was 9.4%, compared with 4.9% for people without disability.
Levels of participation in the labour force vary depending on the type and severity of disability a person has. For example, people with severe or profound core activity limitations were less likely to be in the labour force (30%) than those with moderate or mild core activity limitations (52%).
Labour force participation rate, people aged 15–64, by disability status, 2012
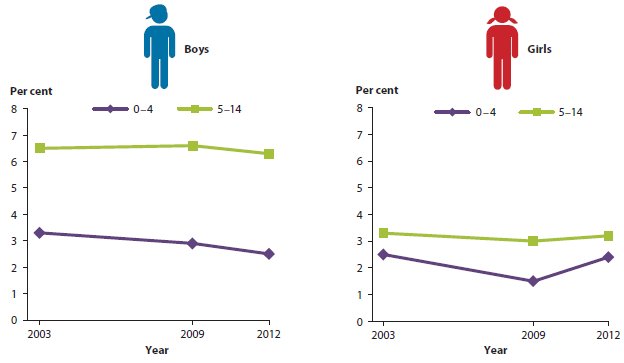
Boys more likely to have severe or profound disability
In 2012, there were about 171,000 children aged 0–14 with severe or profound disability in Australia.
These children are among the most vulnerable in the community.
Of children aged 5–14, more boys than girls had severe or profound disability (6.3% compared with 3.2%).
In 2012, for children aged 0–14, the main types of disability were intellectual (3.8%) followed by sensory/speech (2.9%), physical/diverse (2.8%), psychiatric (2.5%) and acquired brain injury (0.5%).
Severe or profound disability among children aged 0–14, by age group, 2003, 2009, 2012
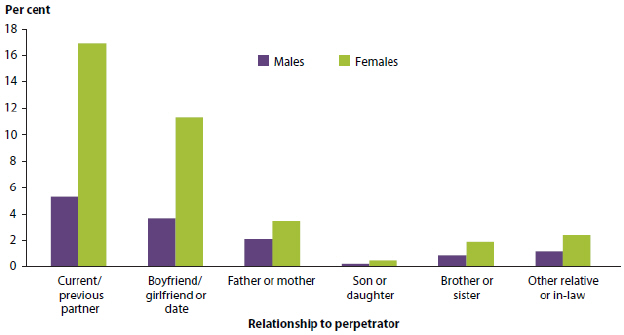
Women more likely to experience domestic and family violence
In 2012, the majority of domestic violence was against women. For example, 85% (51,500) of partner assaults were against women.
Almost 2 million Australians have experienced partner violence since the age of 15, and just over 1 million have experienced physical or sexual violence from another family member.
In 2012–13, Indigenous females were hospitalised for family violence-related assaults at 34 times the rate of non-Indigenous females—and Indigenous males were hospitalised at 28 times the rate of non-Indigenous males.
Domestic violence is a major cause of housing instability and homelessness. In 2013–14, 33% of clients (84,700) were seeking support from specialist homelessness services for domestic violence, and most of these were females aged over 15 (66%). More than one-quarter (26%) were children aged 14 and under.
Experience of violence since the age of 15, by relationship to the perpetrator, by sex, 2012