Education in Australia
Participating and engaging in learning and formal education from an early age are central to a child's development. Completing schooling and higher levels of education (particularly obtaining tertiary level qualifications) offers more employment opportunities and better outcomes, such as higher relative earnings. Low school attainment and poor engagement with school can lead to poorer outcomes in life, including unemployment, poverty and social exclusion.
Formal education starts at age 5 or 6 in Australia and is compulsory until completion of Year 10. Young people must then participate in full-time education, employment or training (or a combination) until age 17.
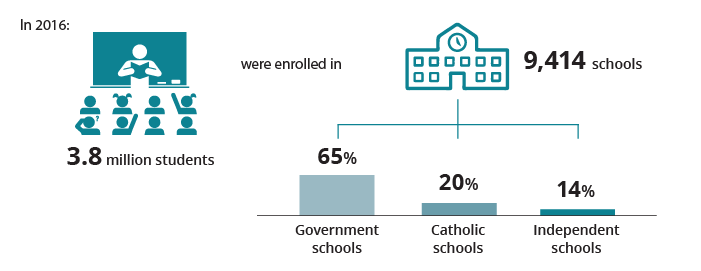
There were 172 registered higher education providers in Australia as at October 2015, 40 of which were universities. In 2015, there were 4,277 vocational education and training providers (including Australian providers operating overseas), enrolling about 4.5 million students. Around 278,500 apprentices and trainees were in training as at September 2016.
As at May 2016, 2.2 million people aged 15-64 were enrolled in formal study towards a non-school qualification—1.3 million (59%) of these at a higher education institution such as a university. Management and commerce (24%) and society and culture (21%) were the most common fields of non-school study.
National literacy and numeracy results steady, but international test results declining
Results in national assessments for literacy and numeracy testing in Years 3, 5, 7 and 9 have largely plateaued for students since 2008. However, reading results did improve for Years 3 and 5 in 2016, particularly for Indigenous students.
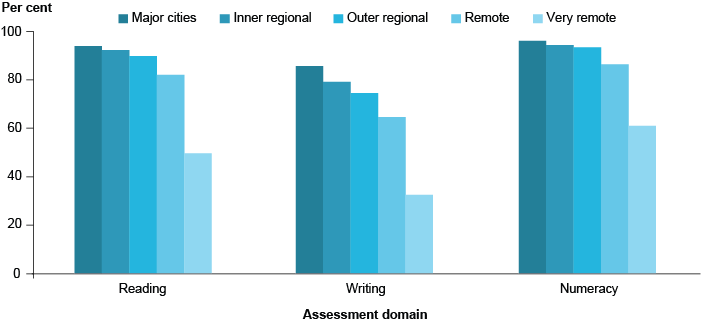
Lower levels of achievement persist for disadvantaged groups of students; for example, for students in Very remote areas, particularly for writing (see Year 9 results in the figure here).
Programme for International Student Assessment testing showed that, in 2015, Australian students performed significantly below students in 9 other countries for science, 11 countries for reading and 19 for mathematics. While Australia's average score in these 3 areas was higher than the average for 35 Organisation for Economic Co-operation and Development countries in 2015, its results are significantly lower than those achieved in 2012.
Year 9 achievement at or above the National Minimum Standard in national assessment for reading, writing and numeracy, by remoteness area, 2016
Find out more: Chapter 3.5 'How are we faring in education' in Australia's welfare 2017.
1 in 11 young people not in education or work
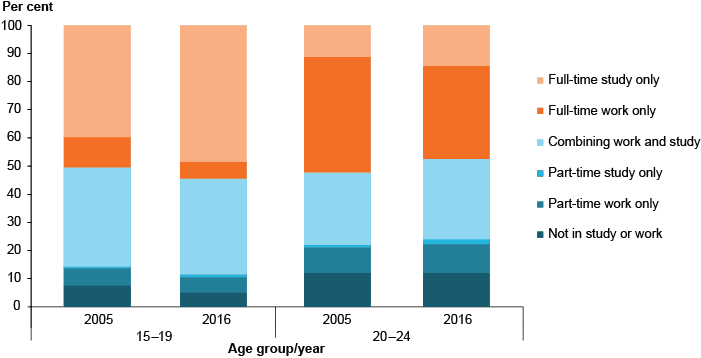
Following compulsory schooling, young people have several education and training options. They can enter the workforce, complete further study, or combine both. Although most (91%) people aged 15-24 were engaged in education and/or employment in 2016, 8.8% were not—5.1% of people aged 15-19 and 12% of people aged 20-24.
Between 2005 and 2016, the proportion of people:
- aged 15-19 not in employment, education or training (NEET) fell (from 7.7% to 5.1%), but the proportion of NEETs aged 20-24 remained similar (at around 12%)
- aged 15-19 and 20-24 engaged in full-time work (and not studying) fell, while the proportion engaged in full-time study (only) rose
- aged 20-24 combining work and study increased slightly—from 26% to 29%.
Participation in education and/or employment, people aged 15–24, by age group, 2005 and 2016
Find out more: Chapter 3.1 'Pathways through education and training' in Australia's welfare 2017.
Enrolments in non-school qualifications on the rise
Higher levels of educational attainment are associated with higher employment rates and higher relative earnings, more social engagement and better health. Non-school education in Australia can be broadly categorised as being either tertiary (also called 'higher education') or vocational education and training (including apprenticeships).
As at May 2016, 2.2 million people aged 15-64 were enrolled in formal study towards a non-school qualification—1.3 million (59%) of these were attending a higher education institution such as a university.
People aged 20-24 made up the highest proportion of people studying for non-school qualifications. Between 2007 and 2016, enrolments increased proportionally for all age groups, with the largest increase seen for people aged 20-24 (from 34% to 42%).
People aged 15-64 enrolled in study towards a non-school qualification, by age group, 2007 to 2016
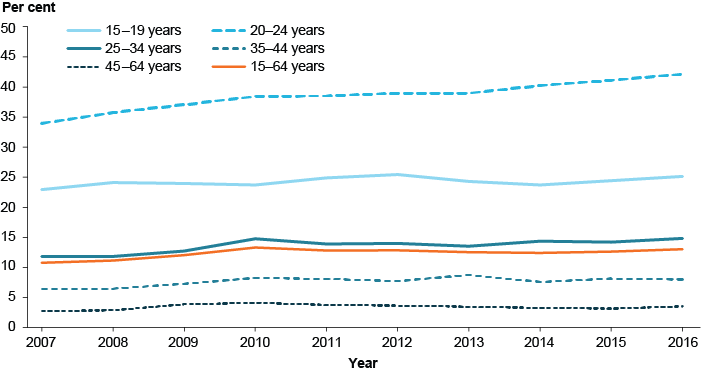
Find out more: Chapter 3.4 ‘Tertiary education’ in Australia’s welfare 2017.
Apprenticeship and traineeship numbers continue to fall
As at 30 June 2016:
- apprenticeship and traineeship commencements (in the previous 12 months) had been falling since a peak in 2012, and were at their lowest since 1998 (168,800 in 2016)
- completions (in the previous 12 months) had also been falling since a peak in 2013, and were at their lowest since 2002 (107,900 in 2016).
Most of the recent decline in apprenticeship and traineeship numbers were in non-trade occupations.
As well as these falls, the proportion of the population who are apprentices and trainees has declined over time for all age groups. For example, the proportion of the population aged 15-19 who were apprentices and trainees declined from 9.4% in 2005 to 6.2% in 2015 (with a peak of 9.9% in 2008).
Apprentices and trainees as a proportion of the population, by age group, 2005–2015
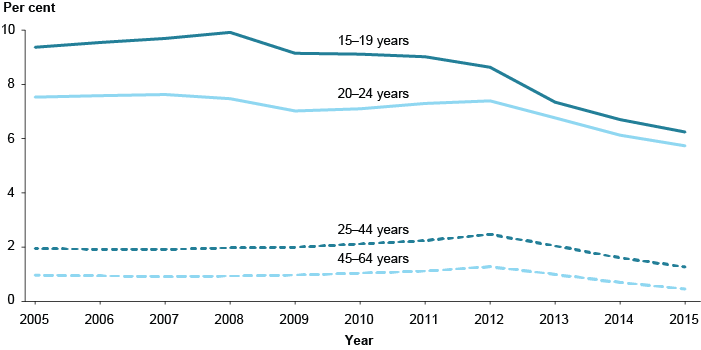
Find out more: Chapter 3.3 ‘Apprenticeships and traineeships’ in Australia’s welfare 2017.
Gaining full-time employment is increasingly challenging for young people
It can be a challenge for some young people to find sustainable or full-time employment, even after graduating from higher education.
- The proportion of young people (aged 15-24) in full-time employment has declined over time. In 2017, 27% of young people worked full time, compared with 35% a decade ago and 48% 3 decades ago.
- The proportion of young people working part time in 2017 was 31%—rising from 28% a decade ago and 13% 3 decades ago.
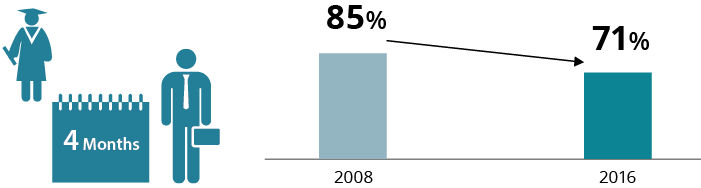
- In 2016, 71% of university graduates were working full time 4 months after finishing their undergraduate degree, a fall from 85% in 2008.
- Most (80-90%) people who complete an apprenticeship or traineeship are employed within 6 months of finishing their training.
University graduates working full time 4 months after finishing their undergraduate degree, 2008 and 2016
Find out more: Chapter 3.1 ‘Pathways through education and training’ in Australia’s welfare 2017.