Housing and homelessness
Access to affordable, secure and appropriate housing can help to reduce the likelihood that a person will experience social exclusion, overcrowding, homelessness, and poor physical and mental health.
Homelessness can profoundly affect a person's health (mental and physical), education and employment opportunities, and their ability to participate fully in social and community life.
The number of households in Australia is growing and is expected to continue to grow into the future:
- 9.4 million in 2017
- 12.7 million in 2036
The demand for social housing in Australia is high. (Social housing is rental housing funded or partly funded by government, and provided by the government or a community organisation to eligible persons.) Assistance is prioritised for households in greatest need. Around 394,000 households were living in social housing in 2015-16—a 4% increase since 2007-08.
Governments across Australia fund a range of specialist services to support people who are homeless or at imminent risk of homelessness. The latest estimate of homelessness is from the 2011 Census, when more than 105,000 Australians were homeless. In 2015-16, specialist homelessness services supported 1 in 85 people (280,000 people).
Family, domestic and sexual violence is the leading cause of homelessness and housing instability in Australia, and is consistently one of the most common reasons clients seek assistance from specialist homelessness services (SHS). In 2015-16, 38% of SHS clients had experienced family and domestic violence and 92% of these were women and children. The number of family and domestic violence clients has increased by 33% since 2011-12.
Falling affordability for renters and buyers
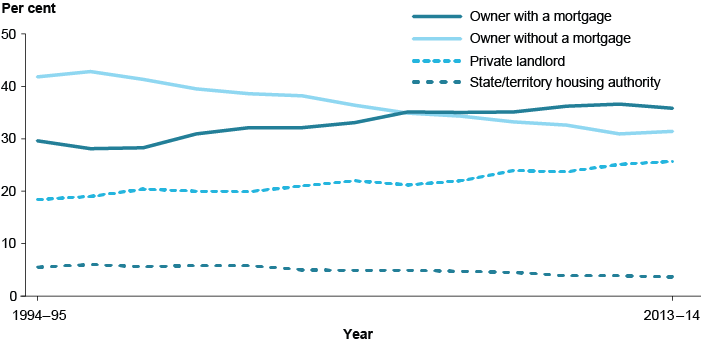
House prices have risen substantially in recent decades. A growing proportion of people are renting and a decreasing proportion own their houses outright.
Over the last 2 decades, the proportion of Australians who own their home, with or without a mortgage, fell from 71% to 67%. More home owners financed their purchase with a mortgage (rising from 30% to 36%) and fewer owned their home outright (dropping from 42% to 31%).
Home ownership rates have been falling most dramatically for young people over the last 25 years: 39% of people aged 25-34 owned a home in 2013-14, compared with 60% in 1988-89.
Affordability is also diminishing for households that rent, with renters experiencing a 62% (or $144) increase in average weekly housing costs over the last 2 decades.
Changes in housing tenure in Australia, 1994–95 to 2013–14
Find out more: Chapter 6.3 'The changing shape of housing in Australia' in Australia's welfare 2017.
Australian home ownership rates not high compared with other OECD countries
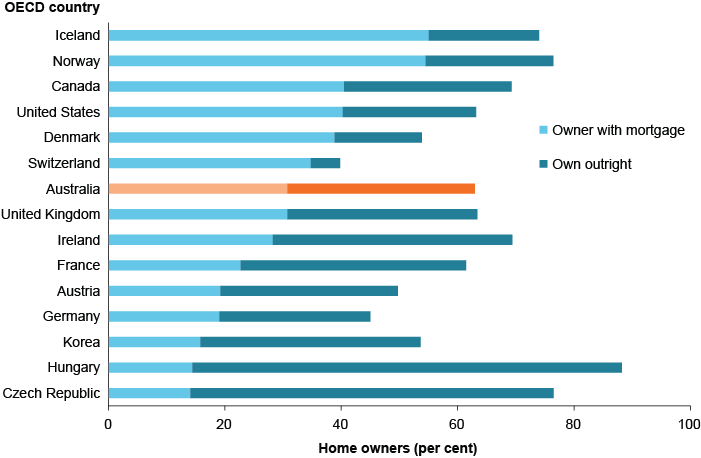
Home ownership is still the most common tenure type in Australia, though it is declining. In contrast, home ownership rates have tended to grow over recent decades in many Organisation for Economic Co-operation and Development (OECD) countries, despite some large differences.
Australia ranks in the lowest third of OECD countries for aggregate home ownership rates (29th of 35 OECD countries, with and without a mortgage), but we rank in the top third (12th highest) for home owners with a mortgage.
Home ownership distribution in selected OECD countries, 2014 or most recent year
Find out more: Chapter 6.3 'The changing shape of housing in Australia' in Australia's welfare 2017.
Social housing serving those in greatest need
Around 195,000 households were on social housing waiting lists in June 2016. The wait to enter social housing can be long. The wait is generally not as long, though, for households in greatest need (whose members can also have special needs, such as living with disability or experiencing domestic and family violence).
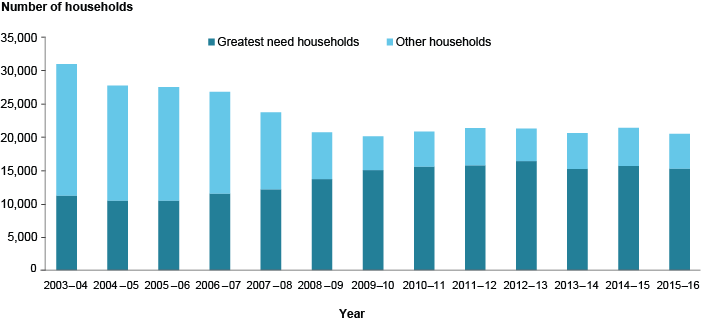
The proportion of newly assisted households in greatest need has more than doubled in the last 12 years. In 2015-16, 15,300 or 74% of households in public rental housing programs (the largest social housing program) were those in greatest need, compared with around 11,200 or 36% in 2003-04. The total number of newly assisted houdeholds fell from 31,000 to 20,500 over the same period, partly because of a reduction in public rental housing dwelling stock.
Number of newly assisted households in greatest need and other households in public rental housing, 2003-04 to 2015-16
Find out more: Chapter 6.1 'Social housing' and Chapter 9.2 'Indicators of Australia's welfare' in Australia's welfare 2017.
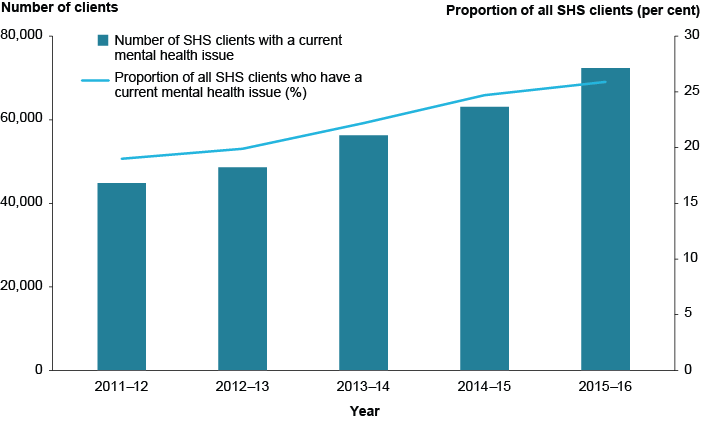
1 in 4 people accessing homelessness support have mental health issues
'Mental health issues' is one of the main pathways into homelessness. Specialist homelessness services (SHS) clients with a current mental health issue make up the fastest growing client group within the SHS population, growing at an average rate of 13% per year since 2011-12.
SHS clients with a current mental health issue: total number and as a proportion of all SHS clients, 2011–12 to 2015–16
Find out more: Chapter 6.2 ‘Homelessness’ in Australia’s welfare 2017.