Welfare in Australia
In its broadest sense, welfare refers to the wellbeing of people. Attributes linked to positive wellbeing include being secure, happy, healthy and safe.
Individual circumstances, attitudes and behaviours can all affect a person's wellbeing, as can broader factors, such as access to education, employment and secure housing.
Many people do not need support, or their need for support may vary as their circumstances and life stage change. If support is needed, it can come from a variety of sources – families, friends and communities, or through financial support or formal services. Services may be provided by government and non-government organisations across a range of areas.
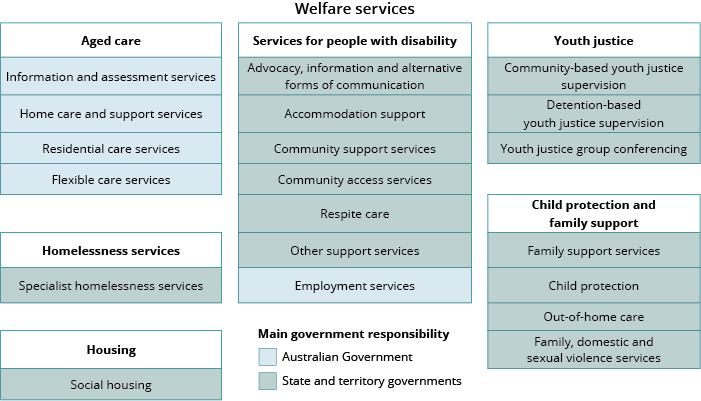
Major welfare service types in Australia's welfare, by main government responsibility
Almost $160 billion spent on welfare
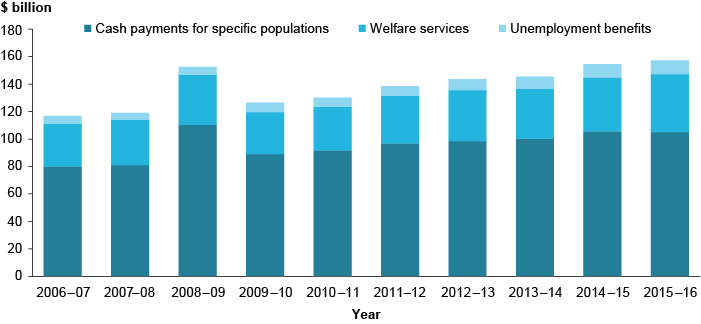
The Australian Government and state and territory governments spent an estimated $157 billion on welfare in 2015-16 (cash payments and welfare services only), up from $117 billion in 2006-07. This was an average annual growth rate of 3.4%. Welfare spending also now accounts for a larger proportion of gross domestic product than before: 9.5% in 2015-16 compared with 8.6% in 2006-07.
Of the $157 billion spent on welfare:
- 67% ($105 billion) was cash payments for specific populations (excluding unemployment benefits)
- 27% ($42 billion) was for welfare services
- 6.3% ($10 billion) was cash payments for unemployment benefits.
Government welfare expenditure, constant prices, 2006–07 to 2015–16
Tax expenditure or concessions by the Australian Government for welfare amounted to $47 billion in 2015-16 (on top of the $157 billion in spending). Most of this (75%) was for concessions for superannuation to help people fund their retirement. Around $4 billion (9%) was for concessions for families and children.
Find out more: Chapter 1.4 ‘Welfare expenditure’ in Australia’s welfare 2017.
Australia top of OECD in means testing rates
In Australia, income support payments are subject to means testing. This process determines eligibility for benefits, and helps to ensure that resources focus on supporting people with relatively lower incomes and fewer assets.
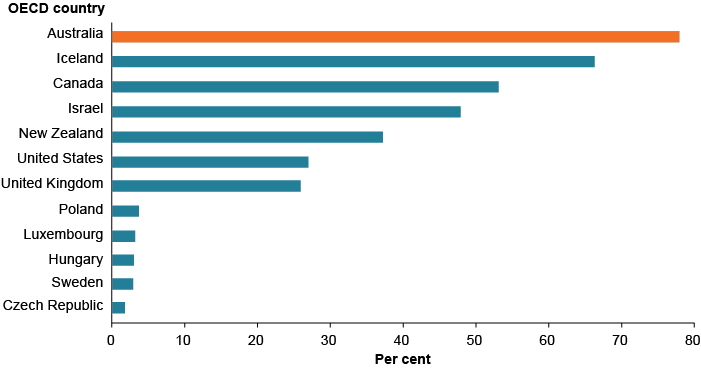
Means testing plays a more prominent role in Australia than in other countries. In fact, we are the highest means-testing country in the Organisation for Economic Co-operation and Development (OECD). Around 80% of our spending on cash benefits (for example, age pensions and unemployment benefits) is determined by means testing.
Government spending on income and means-test benefits as a proportion of public social spending on cash benefits, by selected OECD countries, 2012 or latest year available
Australia targets social benefits spending to those in most need. In 2011, around 42% of social spending on cash benefits went to the lowest (or most disadvantaged) quintile of households; only 3.8% went to the highest 20% of households in Australia.
Find out more: Chapter 1.3 ‘Understanding welfare’ in Australia’s welfare 2017.
A growing welfare workforce
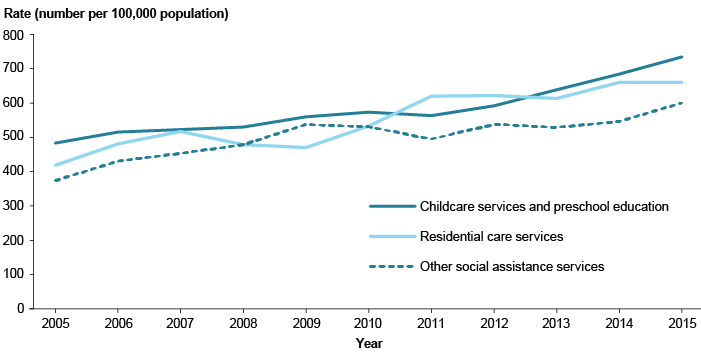
In 2015, an estimated 478,000 people were employed in the welfare workforce – an increase of 84% since 2005.
The welfare workforce can be grouped into three categories: child care services and preschool education, residential care services, and other social assistance services. All three service areas grew between 2005 and 2015.
Number of employed people in the welfare workforce per 100,000 population, by type of community service industry, 2005 to 2015
Two occupation groups made up more than 60% of the welfare workforce in 2015:
- 'early childhood education and care' workers – 170,300 workers
- 'aged and disabled' carers – 123,200 workers.
Find out more: Chapter 1.5 ‘Welfare workforce’ in Australia’s welfare 2017.
Some Australians face persistent disadvantage
About 4.4% (1 in 23) of Australians are estimated to face deep and persistent disadvantage. Some groups in the community face rates of disadvantage that are much higher than the national average. For example, almost 1 in 4 people living in public housing experience deep and persistent disadvantage, as do 1 in 6 who depend on income support, and 1 in 8 who are unemployed.
An estimated 17% of Australian children aged under 15 were living in poverty in 2014 – up from 15% a decade earlier.
| Group | Facing deep and persistent disadvantage (%) |
|---|---|
| Living in public housing | 23.6 |
| Dependent on income support | 15.3 |
| Unemployed | 11.5 |
| Lone parents | 11.3 |
| With a long-term health condition or disability | 11.2 |
| Indigenous Australians | 10.8 |
| Highest educational attainment Year 11 or below | 9.3 |
| All Australians | 4.4 |
Find out more: Chapter 1.6 ‘Persistent disadvantage in Australia: extent, complexity and some key implications’ in Australia’s welfare 2017.