This page was written by the Centre for Population at Treasury for the AIHW.

Overview

Australia’s population was 26.6 million at 30 June 2023, having grown around 1.4% a year on average over the past 3 decades, from 17.6 million at 30 June 1993.

Over this 30-year period:

  • Net overseas migration (see glossary) was the main driver of population growth, directly contributing just over half of total population growth over the whole period. 
    • Net overseas migration increased from a net inflow of 30,000 people in 1992–93 to 241,000 people in 2018–19. The introduction of international border restrictions in response to the COVID-19 pandemic led to the first net outflow of migrants from Australia since the Second World War (-85,000 people in 2020–21), before recovering to a net inflow of 528,000 people in 2022–23 as restrictions eased.
  • Natural increase (births minus deaths) contributed almost half of population growth, although it has decreased from 139,000 people in 1992–93 to 106,000 people in 2022–23:
    • Fertility rates (see glossary) have declined, from 1.86 babies per woman in 1992–93 to 1.58 in 2022–23.
    • The number of deaths has grown faster than the number of births over this period, reflecting the declining fertility rate and ageing of the population.
    • Life expectancies at birth (see glossary) have continued to increase, from 75.0 years for males and 80.9 years for females in 1993, to 81.2 years for males and 85.3 years for females in 2020–20­22.
  • Australia’s population has grown older, with the median age increasing from 33.0 years at 30 June 1993 to 38.3 years at 30 June 2023. The percentage of the population aged 65 and over has increased from 12% to 17% over the same period.

Australia’s population is concentrated in the Major cities, which are home to 73% of the total population. Around 1 in 4 (26%) live in Inner regional and Outer regional Australia, with the remainder (2%) living in Remote and very remote areas (Figure 1).

Australia’s capital cities tend to be younger and age more slowly than regional areas. This is mainly because capital cities have historically attracted a larger share of overseas migrants, who tend to be younger than the overall population. In addition, younger people tend to move into capital cities from regional areas to pursue educational and job opportunities. While retirement-age people are less likely to move, when they do, they often move out of capital cities to regional areas. These factors more than offset higher fertility rates and lower life expectancies in regional areas.

Australia’s population is diverse. In 2022, 29.5% of people in Australia were born overseas (Figure 1), and almost half (48%) have a parent born overseas (ABS 2022; ABS 2023a). The Aboriginal and Torres Strait Islander (First Nations) population was 3.8% of the total Australian population at 30 June 2021, with 984,000 First Nations people (ABS 2023b).

The impact of COVID-19 on population growth

Australia’s population growth was affected by the COVID-19 pandemic and the measures taken to limit the spread of the disease. Following the easing of international border restrictions and the return of overseas migration in late 2021, Australia’s population growth recovered to 2.4% in 2022–23, from a historical low of 0.1% in 2020–21.

Longer-term trends prior to the pandemic, such as the ongoing decline in the fertility rate, the decline in the rate of internal migration, and the slower rate of mortality improvement observed in recent years, continue to affect the size and distribution of the population. Over 2020–22, Australia recorded a decline in life expectancy (see glossary) for the first time since the early 1990s, by 0.1 years for both males and females. The COVID-19 pandemic is expected to continue to result in life expectancy being below the pre-pandemic trend before returning to the trend by 2026–27 (Centre for Population 2023).

Figure 1: Demographic snapshot, at June 2022 and June 2023 

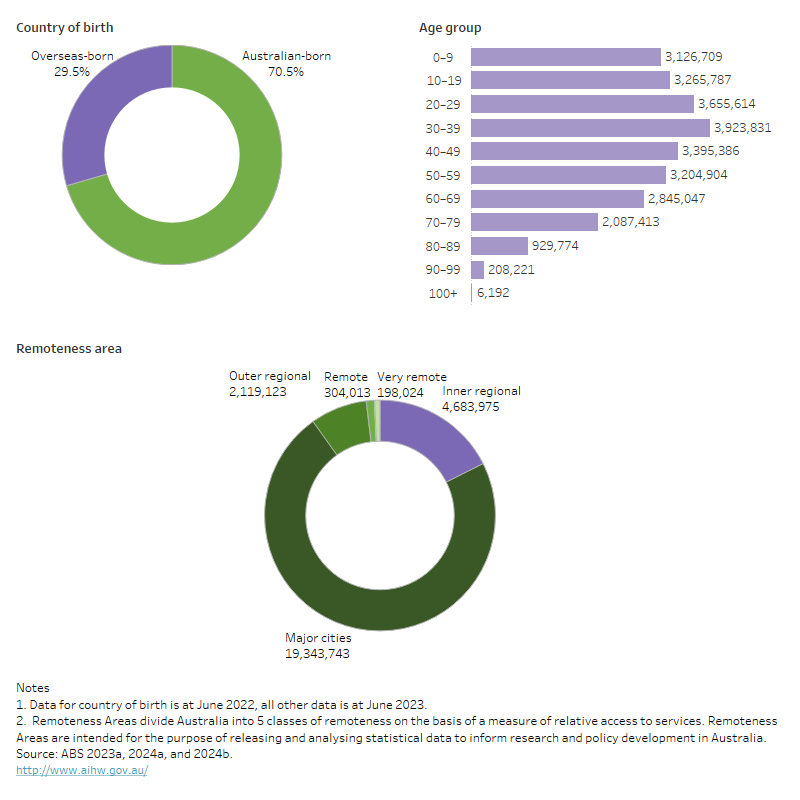
This chart shows a demographic snapshot of Australia’s population for 2021–22 and 2022–23. The percentage of overseas-born residents was 30% compared to Australian-born at 70%. People aged 30–39 now represent the largest age group in Australia. Australia’s overall population has been growing older over time, with the share of people aged 65 and over increasing from 12% in 1992–93 to 17% in 2022–23. The majority of Australians reside in Major cities of Australia with the next most populous region being Inner regional Australia, followed by Outer regional Australia, Remote and Very remote Australia.

Past population growth and trends

Australia’s population growth averaged 1.4% per year from 30 June 1993 to 30 June 2023. Natural increase has been relatively steady, while net overseas migration (see glossary) has fluctuated (Figure 2). Natural increase was the main driver of population growth during the early 1990s. However, from 2005–06 net overseas migration contributed more to annual population growth until the introduction of international border restrictions in response to the pandemic. As border restrictions eased, net overseas migration returned as the main driver of population growth in 2021–22. When averaged over the whole period, net overseas migration contributed 56% of population growth and natural increase contributed 44% of population growth.

More than two-thirds (68%) of Australia’s population lived in the 8 capital cities at 30 June 2023, increasing from 65% in 1992 (ABS 2019; ABS 2024a). Over this period, most capital cities generally grew faster than their respective regional areas as overseas migrants tend to settle in cities and the younger age structure of cities results in greater natural increase.

In 2020–21, border restrictions and lockdowns led to regional areas growing at a faster rate than capital cities for the first time since 1993–94, with lower net overseas migration and fewer moves from regional areas to capital cities. In 2021–22, population growth in capital cities returned, growing slighter faster than regional areas (ABS 2024a).

Figure 2: Components of population change, Australia, 1992–93 to 2022–23

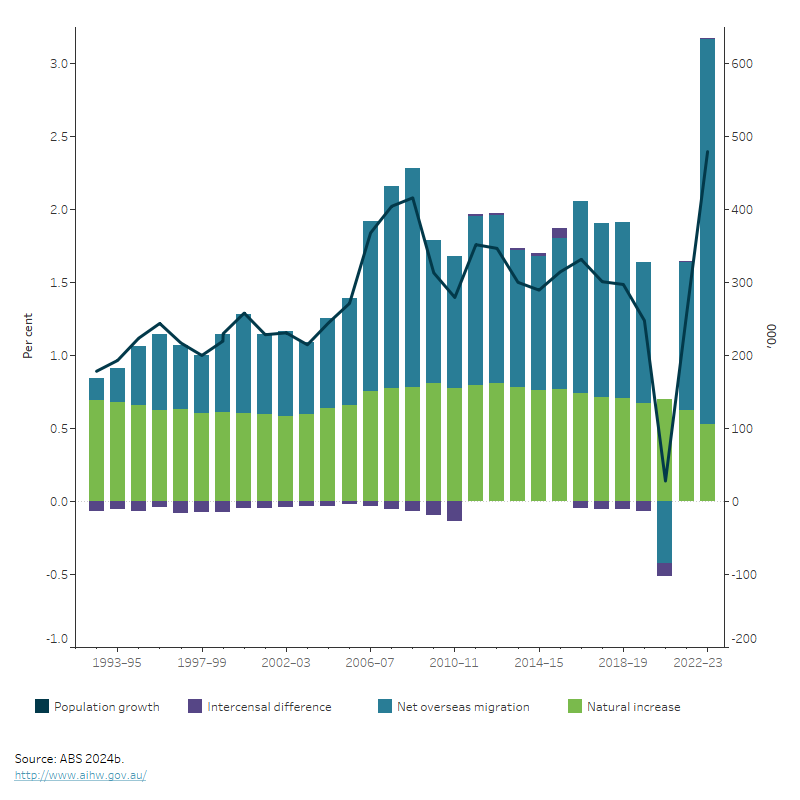
This chart shows the contributions of net overseas migration, and natural increase to Australia’s historical population growth. Australia’s population growth from 30 June 1993 to 30 June 2023 averaged 1.4% a year. While the contribution from natural increase has been steady, there have been fluctuations in net overseas migration. From 2005–06 to 2020–21, net overseas migration contributed more to population growth than natural increase. Although there was a net outflow of migrants in 2020–21, natural increase meant that population growth, although low, was not negative. In 2021–22, the easing of international border restrictions meant overseas migration and population growth began to recover and this continued in 2022–23.

Net overseas migration

Net overseas migration (see glossary) was the main driver of Australia’s population growth in the years prior to the COVID-19 pandemic.

Net overseas migration is the component of population change that has been most affected by the COVID-19 pandemic. The introduction of international border restrictions in early 2020 lowered net overseas migration to -85,000 persons in 2020–21, the first recorded net outflow since the Second World War. Following the easing of international border restrictions from late 2021, net overseas migration grew to 204,000 persons in 2021–22 to return to being the main driver of population growth, before further increasing to 528,000 persons in 2022–23. Much of the higher net overseas migration reflects a catch-up from the pandemic, as well as a surge in global demand for international study and a strong domestic labour market (Centre for Population 2023).

Natural increase

Since the late 2000s, natural increase has added on average around 150,000 people a year to the Australian population, although this has become smaller as a proportion of the population over time. Over the past 30 years, the total fertility rate has fallen from 1.86 babies per woman in 1992–93 to 1.58 in 2022–23, remaining below the replacement rate (see glossary) of 2.1 since the mid-1970s (ABS 2019, 2024b). At the same time, life expectancies at birth have increased and are among the highest in the world. Despite improving life expectancy (see glossary), the number of deaths has grown faster than births in recent years, reflecting Australia’s ageing population.

The impact of the COVID-19 pandemic on Australia’s fertility appears to have been relatively short-lived, with a small drop and subsequent rebound in births in 2021. This suggests that people adapted to the uncertainty of the pandemic and quickly caught-up on delayed childbearing plans (Gray et al. 2022).

Over the year to June 2023, there were 296,000 births, a decrease of 4.1 per cent from the previous year (309,000), and below the number of births in the prior to the pandemic in 2018–19 (305,000 births) (ABS 2024b).

Compared with many other advanced economies, Australia experienced low mortality during the early years of the COVID-19 pandemic. However, as infection rates increased from 2022, deaths from both COVID-19 and other causes increased. In 2022, deaths (191,000) were 11.7% higher than expected. This was a total 19,900 excess deaths in 2022 (or, 11,560 excess deaths after accounting for deaths above usual variation). During the first eight months of 2023, excess mortality continued but eased to 6.1%. COVID-19 remains a significant contributor to excess mortality, with deaths from or with COVID-19 accounting for around two-thirds of excess deaths since the start of 2022 (ABS 2023c).

Net interstate migration

Australia has high rates of internal migration compared to other countries, although this rate has declined from peaks in the 1980s and 1990s (ABS 2018).

The COVID-19 pandemic reduced net internal migration across Australia as state and territory governments temporarily restricted movements in some cities, regions and across state borders. There was an 11.6% drop in the number of interstate moves from 2018–19 (476,000) to 2019–20 (421,000). There was a further fall to 366,000 in the year to June 2021. Recorded interstate moves increased in the year to June 2022 (484,000), but it is unlikely this many moves actually occurred (for more information, see National, state and territory population methodology). Interstate moves still remain below pre-pandemic levels, with 372,000 interstate moves recorded in the year to June 2023 (ABS 2024b).

Australia’s population in a global context

Prior to the COVID-19 pandemic, Australia’s population growth rate was higher than that of most other advanced countries, largely as a result of net overseas migration. Population growth decreased to 0.1% in 2021 due to a net outflow of migrants before increasing to 1.3% in 2022, which was above the OECD average for OECD countries (Figure 3). For other countries (not OECD members), China experienced no population growth (0.0%) while India (0.7%) and Indonesia (0.6%) experienced lower growth.

Figure 3: Population growth by country, 1992 to 2022 

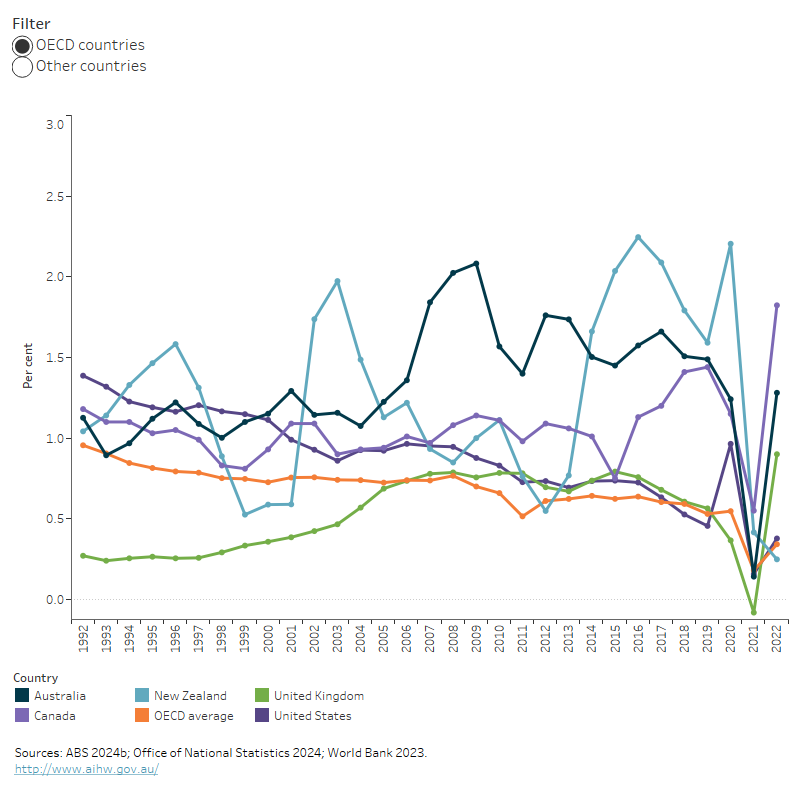
This charts shows the annual population growth of Australia, Canada, China, India, Indonesia, New Zealand, the United Kingdom and the United States. Australia’s population growth rate is higher than that of most developed countries. In 2022, it was 1.3%, above the OECD average of 0.3%.

Australia’s future population

From 2023–24, net overseas migration is expected to slow, leading to a return to the pre-pandemic trend of slowing population growth. Figure 4 illustrates the population growth projections from the 2023 Population Statement. The 2023 Population Statement is the fourth edition of the Centre for Population’s flagship annual publication. Each year’s Statement provides insights on how the population has changed and projects future population changes over the next decade.

Figure 4: Projected population growth and components, Australia, 2023–24 to 2033–34

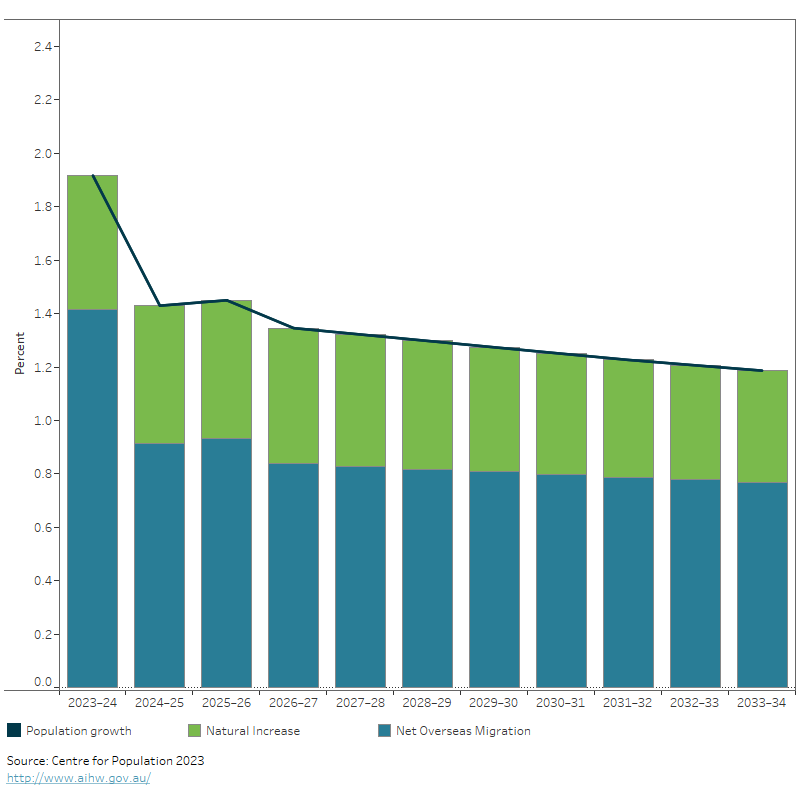
This chart shows projections of Australia’s population growth, detailing the yearly contribution of net overseas migration and natural increase. Australia’s population is expected to soften to 1.9% in 2023–24, before gradually declining to 1.2% by the end of the medium-term in 2033–34. Net overseas migration is forecast to remain the strongest contributor to population growth for the entirety of the projections period.

Australia’s population growth is projected to be 1.9% in 2023–24, before gradually declining to 1.2% by 2033–34. By this time, Australia’s population is projected to be 30.9 million (Centre for Population 2023).

Net overseas migration

With the easing of COVID-19 travel restrictions from late-2021, net overseas migration has quickly recovered with the return of temporary visa holders and international students in Australia. Net overseas migration is forecast to be 375,000 in 2023–24 before returning towards pre-pandemic levels from 2024–25 (Centre for Population 2023).

Natural increase

Consistent with the observed long-run trend, natural increase is projected to continue to decline over the next 10 years reaching 127,000 in 2033–34. This decline is due to the number of deaths growing faster than births, as the population ages.

The total fertility rate is projected to continue its long-running decline from 1.65 babies per woman in 2023–24 to 1.62 babies per woman by 2030–31 and remain constant for the remainder of the projections period (to 2033–34). This decline reflects the trend of women having children later in life and having fewer children when they do. While total births are projected to increase from 318,000 in 2023–24 to 345,000 by 2033–34, births as a proportion of the population will fall.

Total deaths are projected to increase from 184,000 in 2023–24 to 218,000 by 2033–34, in line with the increasing size and ageing of the Australian population. The COVID-19 pandemic is expected to slightly increase mortality rates in Australia for those aged 50 and above, until 2025–26, before returning to pre-pandemic trends (Centre for Population 2023).

Net interstate migration

The level of interstate migration is expected to recover, increasing by 9.1% in 2023–24 to 406,000 moves before reaching around 450,000 in 2025–26. The distribution of interstate migration between states and territories is also expected to return to pre-pandemic patterns by 2025–26 (Centre for Population 2023).

States and territories

Population growth is forecast to continue to be strong in most states and territories in 2023–24. Victoria is forecast to be the fastest growing jurisdiction in 2023–24 and 2024–25. Tasmania is forecast to experience the lowest population growth in 2023–24.

From 2025–26, the Australian Capital Territory is expected to overtake Victoria as the fastest growing jurisdiction, driven by net overseas migration and a high contribution from natural increase, which reflects its younger age structure (Centre for Population 2023).

Where do I go for more information?

For the recent population projections, see: 

This page was written by the Australian Government Centre for Population.