High blood pressure
In 2018, 5.1% of the total burden in Australia was due to high blood pressure. High blood pressure was the 4th leading risk factor contributing to disease burden.
These estimates reflect the amount of burden that could have been avoided if all people in Australia did not have high blood pressure.
High blood pressure was causally linked to 12 diseases including 10 cardiovascular diseases, chronic kidney disease and dementia (see ABDS 2018 Risk factor estimates data table).
How much burden was attributable to high blood pressure?
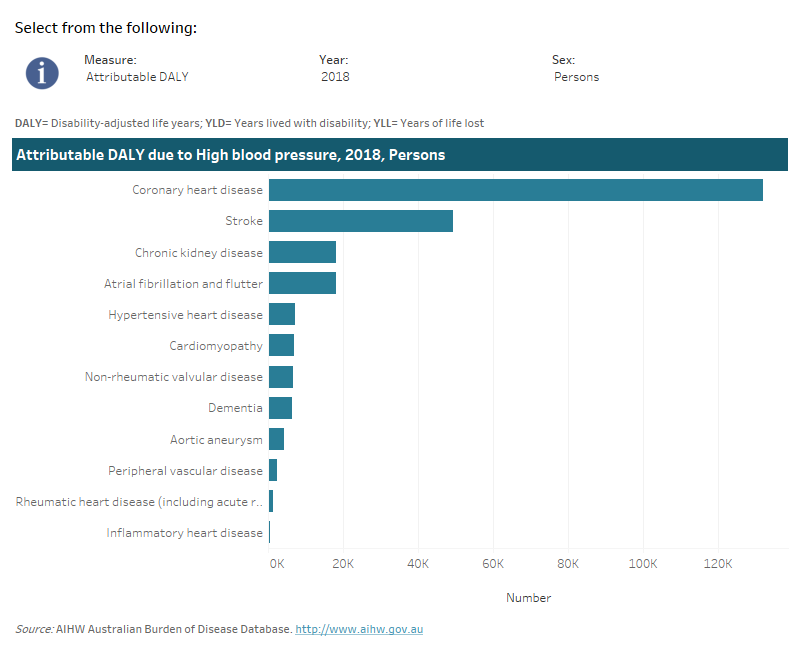
High blood pressure contributed 63% of hypertensive heart disease, 42% of coronary heart disease, 39% of stroke, 37% of chronic kidney disease, and 31% of atrial fibrillation & flutter total burden.
Note that the following visualisation displays the top 10 linked diseases due to high blood pressure by the selected measure.
This interactive data visualisation shows the burden attributable to high blood pressure by linked disease. The main section shows a horizontal bar graph which can be customised to report data according to year, sex and measure of attributable burden. Each bar represents the attributable burden of the disease linked to high blood pressure.

How did burden attributable to high blood pressure vary by age and sex?
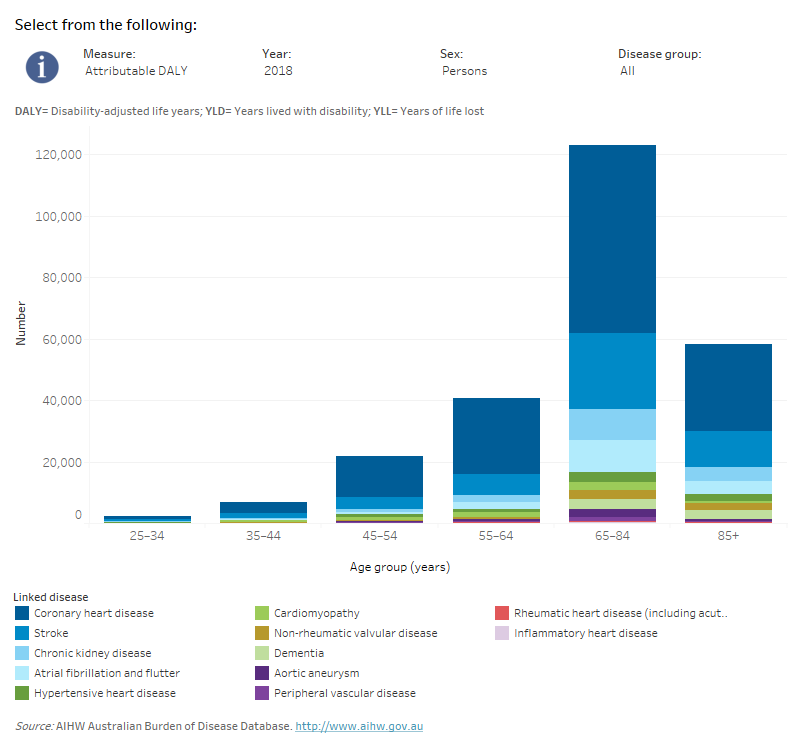
The burden from high blood pressure was estimated in adults aged 25 and over. Total burden due to high blood pressure increased with age, peaking at age 65–84 years.
Males experienced a greater amount of disease burden from high blood pressure than females in all ages up to age 84. Of the diseases linked to high blood pressure, coronary heart disease contributed the most burden from high blood pressure.
This interactive data visualisation shows the amount of burden attributable to high blood pressure by age group and linked disease. The main section shows a stacked bar graph which can be customised to report data according to year, sex, disease group and measure of attributable burden. Each bar represents the attributable burden within a particular age group. Each bar is also split into separate components with each colour representing a disease linked to high blood pressure.

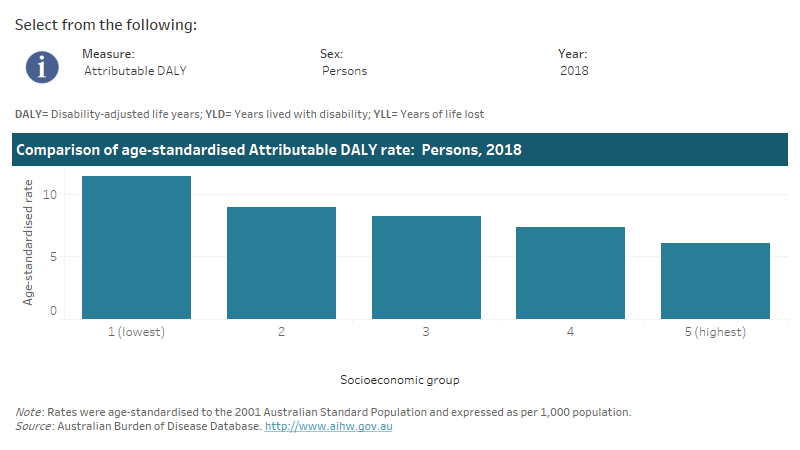
This interactive data visualisation shows the rate of burden attributable to high blood pressure by socioeconomic group. The main section shows a bar graph which can be customised to report data according to year, sex and measure of attributable burden. Each bar represents the attributable burden within a particular socioeconomic group due to high blood pressure.

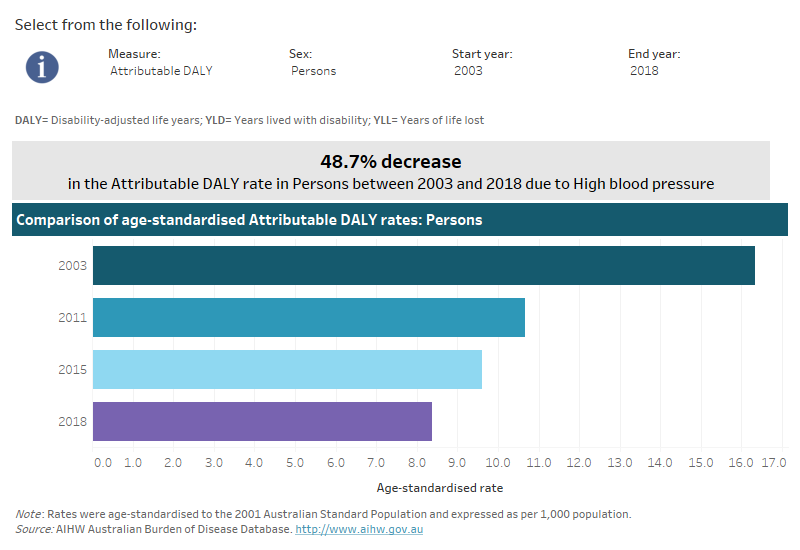
This interactive data visualisation shows the rate of burden attributable to high blood pressure by year. The main section shows a horizontal bar graph which can be customised to report data according to year, sex and measure of attributable burden. Each bar represents the attributable burden within a particular year due to high blood pressure.


