Illicit drug use

In 2018, 3% of the total disease burden in Australia was due to illicit drug use. Illicit drug use includes burden from opioids, amphetamines, cocaine and cannabis and other illicit drug use, as well as unsafe injecting practices.

These estimates reflect the amount of disease burden that could have been avoided if all people in Australia had not used illicit drugs.

Illicit drug use contributed to burden for 15 diseases and injuries; 4 types of injuries, 3 infections, liver cancer, chronic liver disease and 4 types of mental and substance use disorders (see ABDS 2018 Risk factor estimates data table). The linked diseases differed by type of illicit drug.

Individual drug use types

Of the individual drug use types, opioid use was the leading illicit drug use risk, contributing to 0.9% of the total burden in Australia in 2018. This was followed by amphetamine use (0.7% of total burden in 2018) and unsafe injecting practices (0.5%).

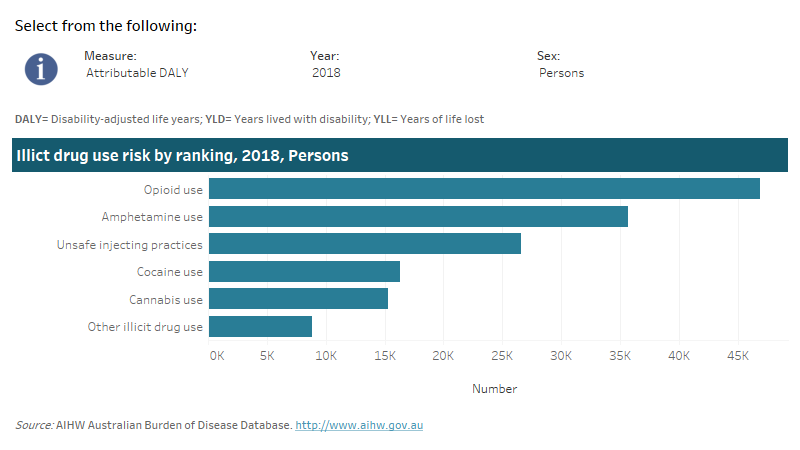
This interactive data visualisation shows the burden attributable to illicit drug use by type of illicit drug. The main section shows a horizontal bar graph which can be customised to report data according to year, sex and measure of attributable burden. Each bar represents the attributable burden due to a particular type of illicit drug.

How much burden was attributable to illicit drug use?

Illicit drug use was responsible for almost all burden due to drug use disorders (excluding alcohol), 74% due to acute hepatitis C, 72% of poisoning, 27% of chronic liver disease and liver cancer, and 15% of suicide and self-inflicted injuries.

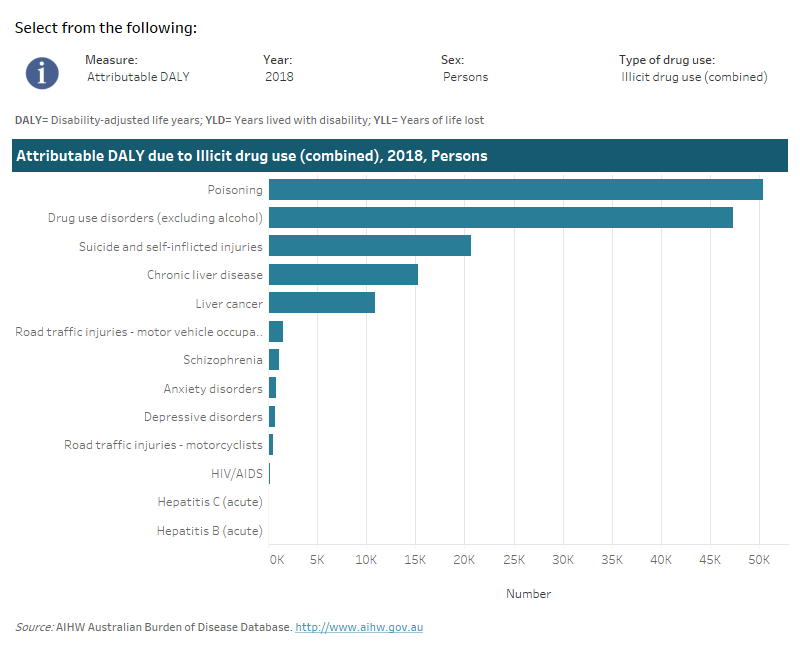
This interactive data visualisation shows the burden attributable to illicit drug use by linked disease. The main section shows a horizontal bar graph which can be customised to report data according to year, sex, type of illicit drug and measure of attributable burden. Each bar represents the attributable burden of the disease linked to illicit drug use.

How did burden attributable to illicit drug use vary by age and sex?

The burden due to illicit drug use was estimated in people aged 15 and over. Disease burden due to illicit drug use was highest in people aged between 25 and 44, peaking in ages 25–34 years.

Males experienced more than twice the total burden from illicit drug use than females up to age 84 years. Drug use disorders (excluding alcohol) were the largest contributor to the illicit drug use attributable burden in people aged 15–34 years. Poisoning was the main contributor to the attributable burden in both males and females aged 35–64.

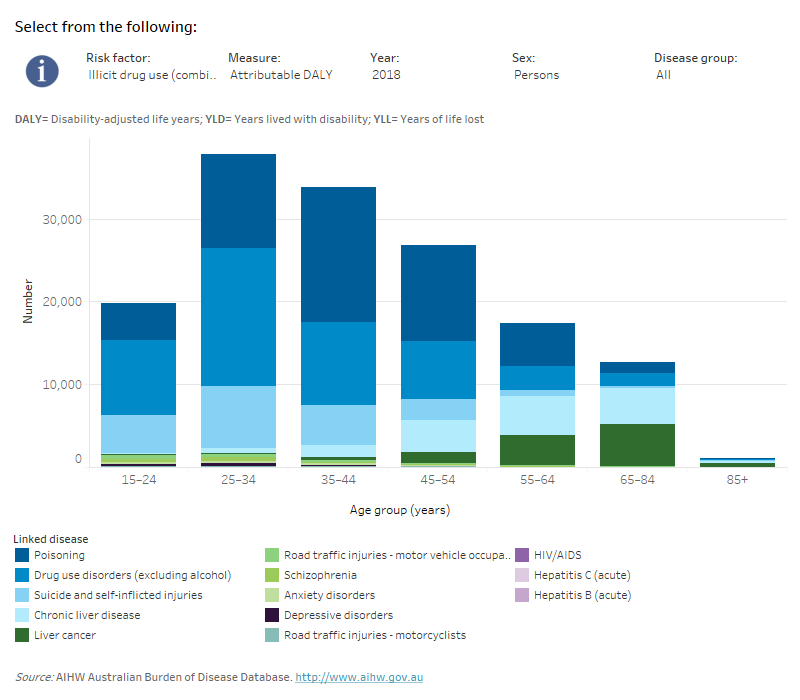
This interactive data visualisation shows the amount of burden attributable to illicit drug use by age group and linked disease. The main section shows a stacked bar graph which can be customised to report data according to year, sex, disease group, type of illicit drug and measure of attributable burden. Each bar represents the attributable burden within a particular age group. Each bar is also split into separate components with each colour representing a disease linked to illicit drug use.

Did attributable burden vary by socioeconomic group?

Total disease burden attributable to illicit drug use was 2.1 times greater in the lowest (most disadvantaged) socioeconomic group compared with the highest (least disadvantaged) group.

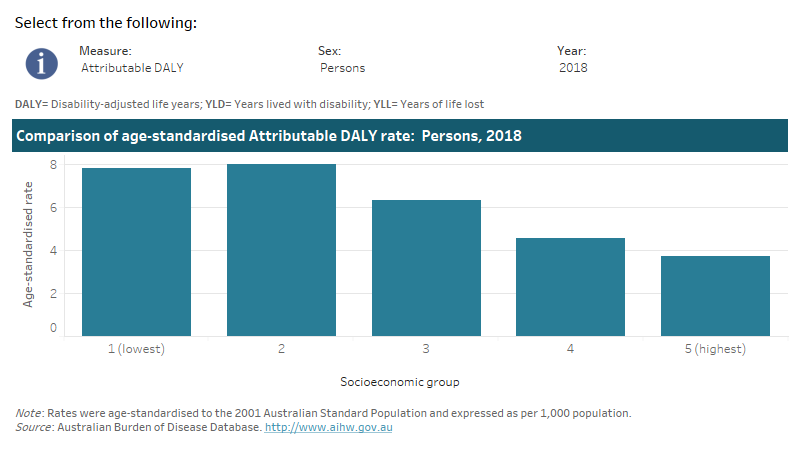
This interactive data visualisation shows the rate of burden attributable to illicit drug use by socioeconomic group. The main section shows a bar graph which can be customised to report data according to year, sex and measure of attributable burden. Each bar represents the attributable burden within a particular socioeconomic group due to illicit drug use.

How has disease burden due to illicit drug use changed over time?

The rate of total burden attributable to illicit drug use increased by 35% between 2003 and 2018 (from 4.5 DALY to 6.0 DALY per 1,000 population).

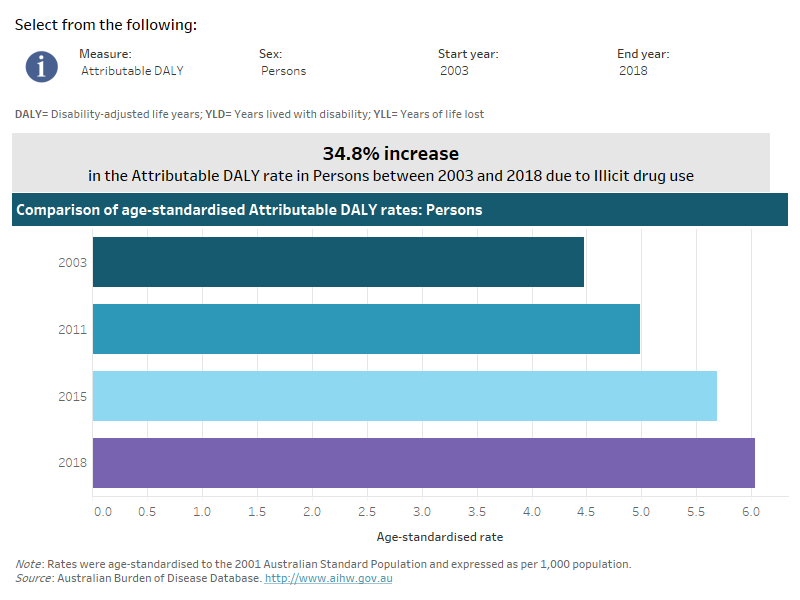
This interactive data visualisation shows the rate of burden attributable to illicit drug use by year. The main section shows a horizontal bar graph which can be customised to report data according to year, sex and measure of attributable burden. Each bar represents the attributable burden within a particular year due to illicit drug use.