Overweight (including obesity)
In 2018, 8.4% of the total disease burden in Australia was due to overweight (including obesity), making it the second leading risk factor contributing to disease burden after tobacco use.
These estimates reflect the amount of burden that could have been avoided if all people in Australia were in the normal weight range (body mass index of 20–25).
Overweight (including obesity) contributed to the burden of 30 diseases including: 17 types of cancer, 4 cardiovascular diseases, 3 musculoskeletal conditions, type 2 diabetes, dementia, asthma and chronic kidney disease (see ABDS 2018 Risk factor estimates data table).
How much burden was attributable to overweight (including obesity)
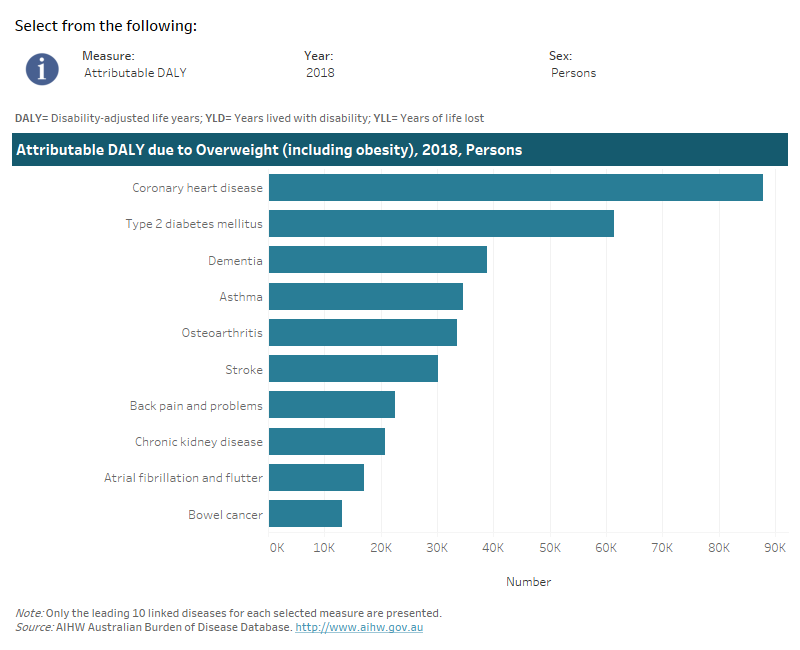
Overweight (including obesity) was responsible for over 55% of the total disease burden due to type 2 diabetes, 51% of the burden due to hypertensive heart disease, 42% of the burden due to chronic kidney disease, 28% of the burden due to coronary heart disease burden, and over 28% of the burden from osteoarthritis.
Overweight (including obesity) was the second-leading contributor to fatal burden, with 16,400 deaths (10% of all deaths) in 2018.
Note that the following visualisation displays the top 10 linked diseases due to overweight (including obesity) by the selected measure.
This interactive data visualisation shows the burden attributable to overweight (including obesity) by linked disease. The main section shows a horizontal bar graph which can be customised to report data according to year, sex and measure of attributable burden. Each bar represents the attributable burden of the disease linked to overweight (including obesity).

How did burden attributable to overweight (including obesity) vary by age?
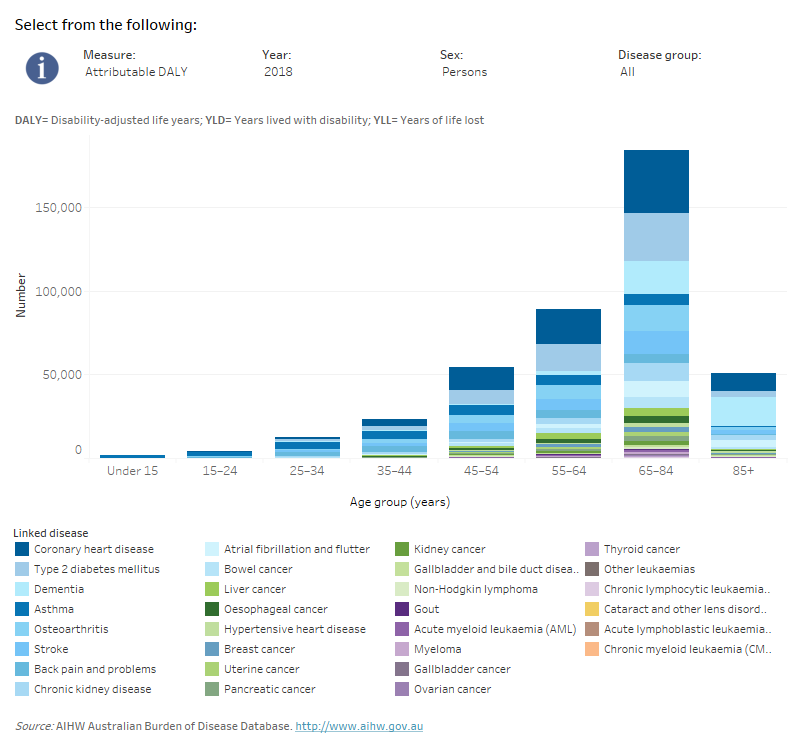
Overweight (including obesity) contributed to disease burden across all age groups, however asthma was the only disease linked to overweight (including obesity) in children aged less than 15 years.
In males aged 35–84 years, the most burden due to overweight (including obesity) was from coronary heart disease. By comparison, the most burden due to overweight (including obesity) in females aged 45–84 years was from coronary heart disease.
This interactive data visualisation shows the amount of burden attributable to overweight (including obesity) by age group and linked disease. The main section shows a stacked bar graph which can be customised to report data according to year, sex, disease group and measure of attributable burden. Each bar represents the attributable burden within a particular age group. Each bar is also split into separate components with each colour representing a disease linked to overweight (including obesity).

This interactive data visualisation shows the rate of burden attributable to overweight (including obesity) by socioeconomic group. The main section shows a bar graph which can be customised to report data according to year, sex and measure of attributable burden. Each bar represents the attributable burden within a particular socioeconomic group due to overweight (including obesity).

How has disease burden due to overweight (including obesity) changed over time?
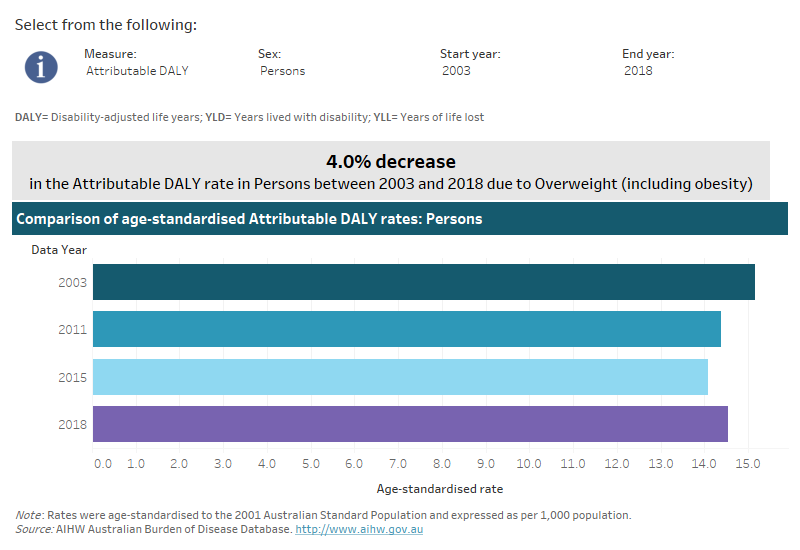
The rate of total burden due to overweight (including obesity) (from all linked diseases) decreased by 4% between 2003 and 2018 (from 15.2 DALY to 14.5 DALY per 1,000 population), though there was a 3% increase between 2015 and 2018 (from 14.1 DALY to 14.5 DALY per 1,000 population). For more detail on the changes in burden over time for this risk factor see Impact and causes of illness and death in Australia 2018 report.
This interactive data visualisation shows the rate of burden attributable to overweight (including obesity) by year. The main section shows a horizontal bar graph which can be customised to report data according to year, sex and measure of attributable burden. Each bar represents the attributable burden within a particular year due to overweight (including obesity).


