Gap in health outcomes

Measuring the ‘gap’ in disease burden between Indigenous and non-Indigenous Australians is of key interest to current policy makers, as reflected in the National Agreement on Closing the Gap’s socioeconomic outcome target to close the gap in life expectancy within a generation (Joint Council on Closing the Gap 2020).

Indigenous and non-Indigenous rates presented, have been age-standardised in order to remove the effect of differences in age structure between the 2 populations. Rate ratios and rate differences are presented as measures of the gap in disease burden.

In addition, results are presented on the diseases contributing most to the health gap (measured as the proportion that each disease group contributes to the total DALY rate difference).

Disease group contribution to the total burden (DALY) varied for Indigenous and non-Indigenous Australians, and by year. Use the interactive graph below to explore data on how much disease groups contributed to total burden in 2018, 2011 and 2003, for Indigenous and non-Indigenous Australians.

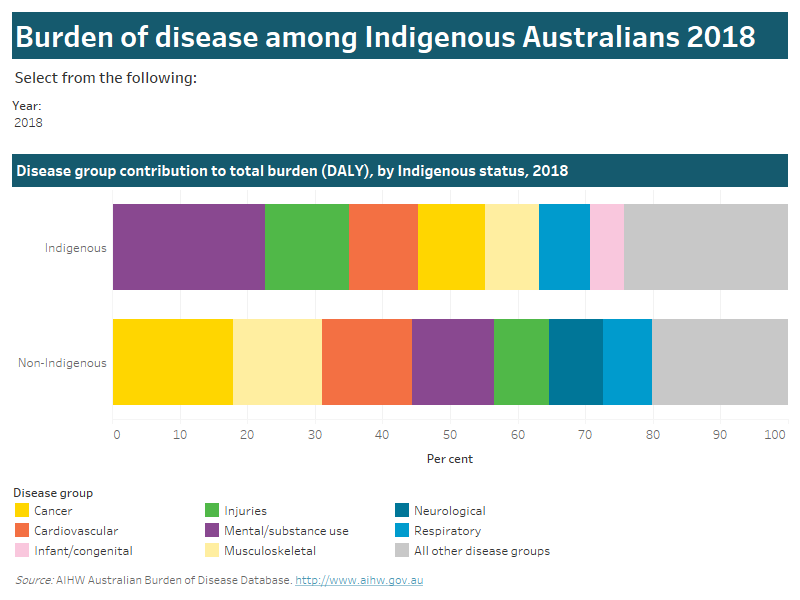
This interactive data visualisation looks at the per cent contribution of disease groups to total burden (DALY, by Indigenous status, for 2018, 2011 and 2003

Use the interactive graph below explore data on the gap in health outcomes between Indigenous and non-Indigenous Australians for 2018, 2011 and 2003. The ‘Contribution’ tab shows disease group contribution to the gap in health outcomes. The ‘Population comparison’ tab compares health outcomes, by disease group using rate differences and rate ratios, and by age group using rate ratios and age-specific DALY rates (per 1,000 people).

See Chapter 6 in the Australian Burden of Disease Study 2018: impact and causes of illness and death in Aboriginal and Torres Strait Islander people report for more information on the gap in health outcomes.


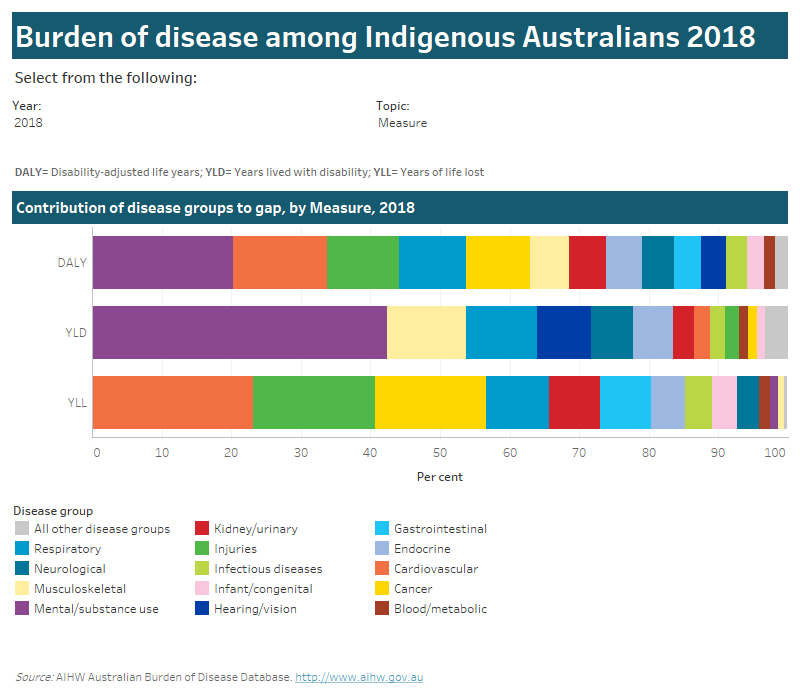
Tab 1: This tab is an interactive data visualisation looking at the per cent contribution of disease groups to the gap in health outcomes by measure (DALY, YLD, YLL), 5-year age groups and sex, for 2018, 2011 and 2003.

Tab 2: This tab is an interactive data visualisation comparing the gap in health outcomes between Indigenous and non-Indigenous populations for 2018, 2011 and 2003. It is possible to view data by disease group and age group using a filter. The chart presenting data by disease group is a column chart with a mark, the columns show the rate difference and the marks show the rate ratios. The chart presenting data by 5-year age groups is a clustered column chart with two columns and mark that crosses both columns. The columns show the age-standardised DALY rates (per 1,000 population) for Indigenous and non-indigenous Australians, while the marks show the rate ratios.

Please use the ‘Download’ button at the bottom of the dashboard to generate image or PDF versions of the data.