All other risk factors
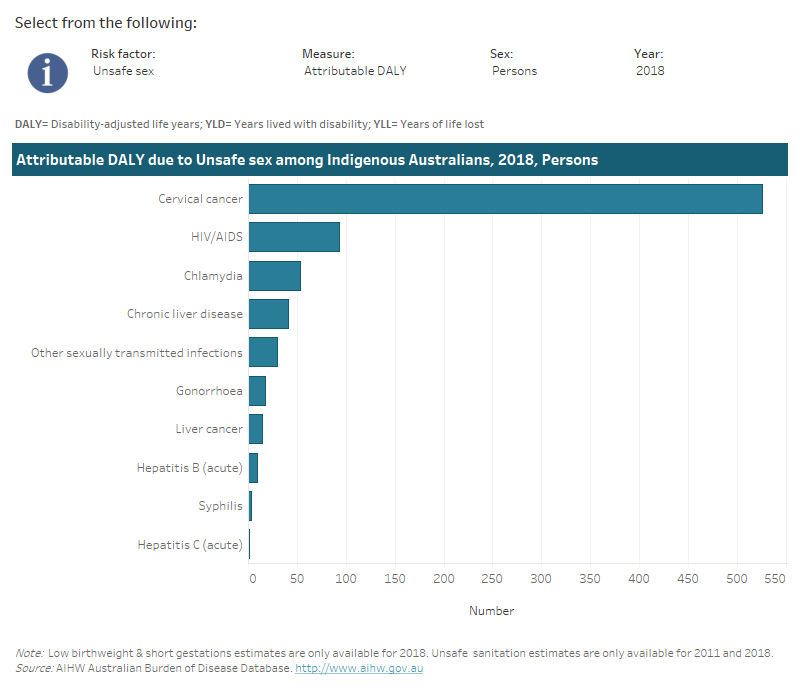
Tab 1: This interactive data visualisation shows attributable burden among Indigenous Australians by linked disease due to either iron deficiency, low bone mineral density and unsafe sex. The main section shows a horizontal bar graph which can be customised to report data according to risk factor, year, sex and measure of attributable burden. Each bar represents the attributable burden of the disease linked to the risk factor.
Tab 2: This interactive data visualisation shows the amount of attributable burden among Indigenous Australians by age group and linked disease due to either iron deficiency, low bone mineral density and unsafe sex. The main section shows a stacked bar graph which can be customised to report data according to risk factor, year, sex, disease group and measure of attributable burden. Each bar represents the attributable burden within a particular age group. Each bar is also split into separate components with each colour representing a disease linked to the risk factor.
Tab 3: This interactive data visualisation shows the rate of attributable burden among Indigenous Australians by year due to unsafe sex. The main section shows a horizontal bar graph which can be customised to report data according to year, sex and measure of attributable burden. Each bar represents the attributable burden within a particular year due to tobacco use.
Tab 4: This interactive data visualisation shows the contribution the selected risk factor had on the gap in health outcomes, or total burden (DALY), between the Indigenous and non-Indigenous population. It is possible to view data for to either low birthweight and short gestation, iron deficiency, low bone mineral density and unsafe sex. There are two sections, the first is key text which reports the risk factors contribution to the gap in disease burden, by year. The second section is a column graph which can be customised using the filter to report age-standardised DALY rates by year and Indigenous status, or DALY rate rate differences and rate ratios by year.