Health adjusted life-expectancy (HALE)
Health-adjusted life expectancy (HALE) extends the concept of life expectancy by considering the time spent living with ill health from disease and injury. It reflects the average length of time a person at a specific age lived in full health.
Estimating the health-adjusted life expectancy
Life expectancy measures the average number of years a person can expect to live, without taking into account how healthy those years of life are. During their lifetime, a person spends time in different states of health. Health-adjusted life expectancy (HALE) extends the concept of life expectancy by considering the time spent living with ill health from disease and injury. It reflects the average length of time a person at a specific age lived in full health. HALE is measured using the morbidity and mortality experienced by the population for a particular reference year. Both life expectancy and HALE are summary measures based on experiences of the population.
HALE is typically reported:
- at birth: describing the average number of healthy years that a baby born in a particular year could expect to live, if they experienced the mortality rates and morbidity rates for that year, and
- at age 65: describing the average number of healthy years that a person at this age could expect during their remaining expected lifetime.
HALE, as described here, differs from disability-free life expectancy in that HALE includes the full experience of ill health and the impact of the health-related consequences; disability‑free life expectancy as reported by the AIHW (AIHW 2021) encompasses a broader scope of functional limitations of disability and selected long-term conditions.
Method for estimating HALE
HALE is one of a range of measures of health expectancy (another, for example, is disability‑free life expectancy).
In the ABDS 2018, Sullivan’s method was used to calculate HALE (see Jagger et al. 2014). This method was chosen for its simplicity and suitability for available data. It requires age‑specific measures of average health and age-specific mortality information from a life table.
Estimating morbidity
Years lived with disability is a measure of the years that could have been spent in full health but were instead spent in ill health. YLD rates describe the combined time spent in ill health per 1,000 population; they are an estimate of the average experience of health loss, adjusted for severity. YLD rates expressed per person can be interpreted as the proportion of the year that each person, on average, spent in ill health, thereby providing a measure of average health in the population during that year. These rates are based on the prevalence of all health outcomes, adjusted for the duration and severity of the health consequences.
For example, if the YLD rate for men aged 40–44 was 96.7 YLD per 1,000 men—on average, each group of 1,000 men in this age group spent a combined time of 96.7 years living in ill health per year. Thus, on average, each male in this age group spent 9.67% of the year in less than full health and, conversely, 90.3% of the year in full health. Compare this with men aged 90–94 who experienced a YLD rate of 420.4 YLD per 1,000 men; that is, on average, men in this age group spent 42% of the year in less than full health and 58% in full health.
Estimating mortality
Life tables are statistical models used to describe the mortality of a population. They describe the number of person-years lived at each age (or age group) and the remaining years of life at each age (the life expectancy) for a hypothetical cohort that experienced the mortality rates of the population of interest in that time period.
Data sources
In the ABDS 2018, HALE was calculated at the national level for 2003, 2011, 2015 and 2018 and for sub-national populations (state and territory, remoteness areas and socioeconomic groups) for 2011, 2015 and 2018. Life table data were sourced from published and customised life tables (see Table 3.14 below).
|
Population |
Data year |
Data source |
|---|---|---|
|
National and state/territory |
2003 |
Life tables, states, territories and Australia, 2002–2004 (ABS 2005) |
|
|
2011 |
Life tables, states, territories and Australia 2010–2012 (ABS 2013) |
|
|
2015 |
Life tables, states, territories and Australia 2014–2016 (ABS 2017b) |
|
|
2018 |
Life tables, 2016–2018 (ABS 2019) |
|
Remoteness |
2011 |
Life tables by remoteness areas, 2010–2012 (ABS 2017d) – customised report |
|
|
2015 |
Life table by remoteness areas, 2014–2016 (ABS 2018b) – customised report |
|
|
2018 |
Life table by remoteness areas, 2016–2018 (ABS 2020b) – customised report |
|
Socioeconomic group |
2011 |
Life tables by Index of Relative Socioeconomic Disadvantage (IRSD), 2010–2012 (ABS 2017c) – customised report |
|
|
2015 |
Life tables by Index of Relative Socioeconomic Disadvantage (IRSD), 2014–2016 (ABS 2018a) – customised report |
|
|
2018 |
Life tables by Index of Relative Socioeconomic Disadvantage (IRSD), 2016–2018 (ABS 2020a) – customised report |
Alignment of non-fatal burden and life table data
The life table data and measures of average health must align to calculate HALE. National and state and territory life table data were available for single year age groups capped at 100 and over, while abridged life table data were used for remoteness areas and socioeconomic groups. That is, age groupings were for 5-year groups (with infant and 1–4 age group splits) and capped at age 85 and over.
YLD rates were available at the national level for 5-year age groups to 100 and over (with infant and 1–4 age group splits) and in the same disaggregation for state and territory, remoteness areas and socioeconomic groups, except the age cap was 85 and over.
As a result, YLD rates (expressed as average health) for a 5-year age group were aligned to each single year age group as appropriate. For example, the YLD rate of 32.74 YLD per 1,000 children aged 5–9 was used to estimate HALE for each single year age group in the life table (5, 6, 7, 8 and 9 years).
As well, state and territory life table data were collapsed for ages 85 and over to align with the YLD rates for states and territories capped at age 85 and over.
Sub-national estimates
HALE estimates for states were calculated using state-specific life expectancy data (ABS 2007, 2013, 2017b) and state-specific YLD rates.
For remoteness areas, HALE was estimated for 4 remoteness areas: Major cities, Inner regional, Outer regional, and Remote and Very remote combined (reported as Remote and very remote), based on the ASGS 2011 for 2011 and ASGS 2016 for 2015 and 2018. HALE estimates for remoteness areas are described in the ABDS 2018 to align with the first age of the age group; for example, HALE at age 65 represents HALE for the age group 65–69.
For socioeconomic groups, life table data were available for 5 socioeconomic groups: groups 1 to 5, based on the 2011 SEIFA IRSD for 2011 and 2016 SEIFA IRSD for 2015 and 2018. The highest socioeconomic group (group 5) represents the least disadvantaged areas and the lowest socioeconomic group (group 1), the most disadvantaged areas. HALE estimates for socioeconomic groups are described in the ABDS 2018 to align with the first age of the age group; for example, HALE at age 65 represents HALE for the age group 65–69.
The AIHW calculates socioeconomic differences using SEIFA indexes divided into population-based quintiles. With this approach, approximately one-fifth of the population is allocated to each quintile, regardless of the underlying geographical area. In this report, the YLD rates used to estimate the proportion of ill health in the 5 socioeconomic groups were derived this way.
Indigenous estimates
HALE for Indigenous and non-Indigenous Australians was estimated at the national level, for 4 states and territories (New South Wales, Queensland, Western Australia and the Northern Territory) and by remoteness area. Estimates for Indigenous Australians were not derived by socioeconomic group as life expectancy data were not available using the same socioeconomic index used for deriving YLD. HALE for Indigenous and non-Indigenous Australians was estimated for 2018 only, as comparable life expectancy estimates for other reference years were not available.
Estimates were calculated using Indigenous- and non-Indigenous-specific life expectancy data (ABS 2018c, 2021 unpublished) and YLD rates for Indigenous and non-Indigenous Australians. HALE estimates for Indigenous and non-Indigenous Australians are described in the ABDS 2018 to align with the first age of the age group; for example, HALE at age 65 represents HALE for the age group 65–69.
Calculating HALE
HALE is calculated by adjusting life table data in proportion to the average health of the population (using YLD rates to estimate the average health of the population).
In the ABDS 2018, HALE is calculated using Sullivan’s method:
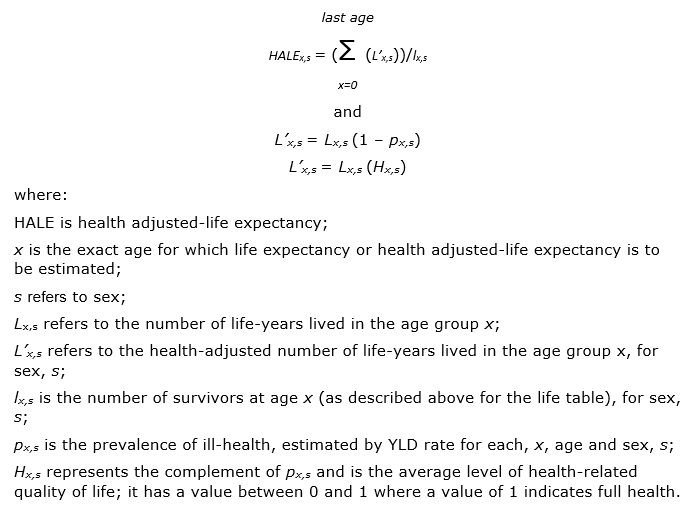
A HALE calculation using Sullivan’s method (with an example from the ABDS 2015) is shown below. The steps are as follows:
Step 1: Calculate the healthy years lived by the cohort
Using data from the life table, adjust the total person-years lived (Lx) in each age group in the hypothetical population by the average time lived in full health (Hx), estimated using the YLD rate; that is, Lx multiplied by Hx. The result is an adjusted total person-years lived, L’x, reflecting the combined time lived in full health in each age group of the cohort.
Step 2: Calculate the cumulative healthy years lived by the cohort
Recalculate the cumulative number of years lived by the cohort from age x to the last age in the life table, considering only the time lived in full health. That is, T’x is the cumulative number of healthy years lived by the cohort from age x to the top age in the life table and is the sum of the total healthy years lived by the cohort (that is, the sum of L’x and L’(x+1)). T’0, for example, represents the total combined healthy years lived by the whole population in the reference year.
Step 3: Recalculate life expectancy based on healthy years lived
The last step is to recalculate the life expectancy using the adjusted cumulative number of healthy years, T’x and the number of people surviving to each age, lx. That is, in the same way that ex is calculated: e’x = T’x/lx. However, e’x is the adjusted life expectancy, or the average number of healthy years lived by the cohort at age x.
The same method was applied to all population groups using life tables and YLD rates specific to all population groups (national, state, remoteness areas and socioeconomic groups) and reference years (2003, 2011, 2015 and 2018).
Table 3.15: Example calculation of HALE, Australia, males, 2014–2016
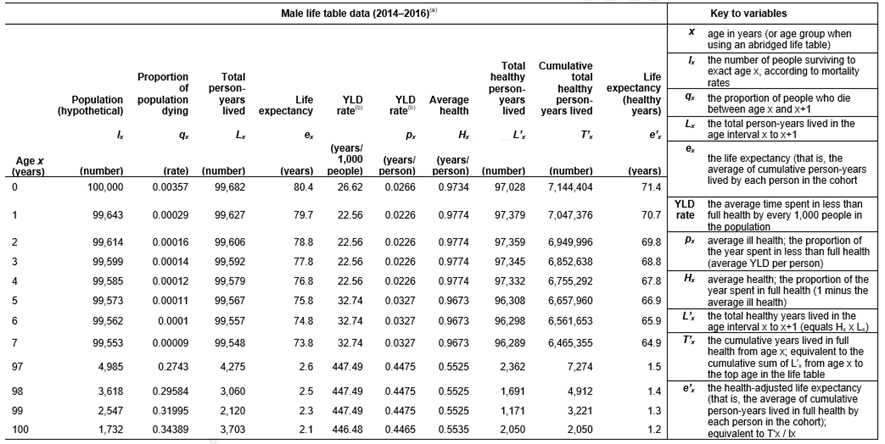 Notes
Notes
- The table was obtained from the ABS Australian Demographic Statistics, Dec 2016 (ABS 2017a).
- The YLD rates were calculated as part of the ABDS 2015.