Overarching methods and choices for ABDS 2018
The ABDS 2018 measured health loss using a summary measure of health called the disability-adjusted life years (DALY). One DALY represents 1 lost year of ‘healthy life’ due to premature death, illness or disability, or a combination of these factors. This measure quantifies the gap between a population’s actual health and an ideal level of health in the given year – that is, every individual living in full health for his or her ideal or potential life span – and includes both fatal and non-fatal components.
A broad overview of the process for estimating DALY is shown in Figure 2.1.
Figure 2.1: Overview of disability-adjusted life year estimation process
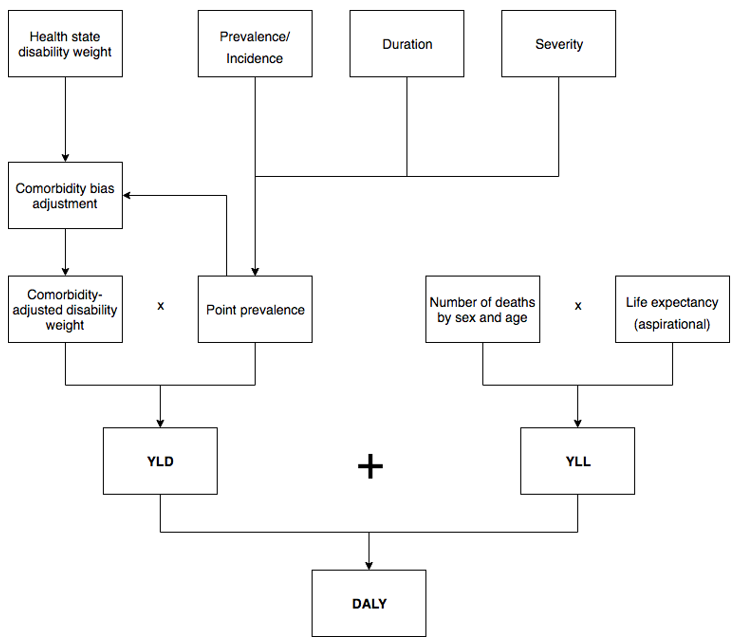
The fatal component is measured using years of life lost (YLL) – 1 YLL represents 1 year of life lost (due to premature death). YLL measures the years lost between the age at which a person dies and an ideal life span according to a reference life table. Total YLL are influenced by both the total number of deaths, and the ages at which those deaths occur.
In the ABDS 2018, the ideal remaining expectancy varied at each age, but started with a life expectancy at birth of 86.0 years for both males and females. This ideal life span was drawn from the reference life table used in the GBD 2010 and 2013 studies, and was based on the lowest observed death rates at each age group from multiple countries (Murray et al. 2012).
See Estimating the fatal burden for more detail on YLL estimation.
The non-fatal component is measured using years lived with disability (YLD) – 1 YLD represents 1 year of life lost (due to the disabling effects of ill health). YLD measures the number of healthy years of life lost due to disease in the reference year. This is calculated by estimating the amount of person-time spent with a condition, multiplied by a disability weight which reflects the severity of the condition. Total YLD are influenced by the number of people with each disease, the time spent in less than full health, and the disability weights defined for each disease consequence. The disability weights used in this study were drawn from the GBD 2013 study, hereafter referred to as the GBD 2013 (see GBD 2013 Collaborators 2015), and represented the health loss caused by the consequences of each disease. Disability weights are further adjusted for comorbidity.
See Estimating the non-fatal burden for further detail on YLD estimation and use of disability weights.
As they use time as a common currency, the YLL and YLD can be summed to measure DALY: 1 DALY represents the loss of 1 year of healthy life.
DALY = YLL + YLD
When DALY are used to measure the burden of disease in a population in a time interval, they can be calculated in various ways: from an incidence, prevalence, or hybrid perspective. Each method produces a measurement of a different quantity. This study used the hybrid perspective for calculating DALY consistent with the ABDS 2011, ABDS 2015 and recent global studies. This calculates YLL from an incidence perspective (see Estimating the fatal burden for details) and YLD from a prevalence perspective (see Estimating the non-fatal burden for details). The main advantage of this approach is that all data needed to calculate DALY can be measured in the period in question.
Constructed this way, DALY can be thought of as an index of population health in a given year, providing a summary measure of the overall population health for the year being reported. This enables diseases, population groups and points in time to be compared.
Reference years 2018, 2015, 2011 and 2003
Based on the availability of data at the start of the study, 2018 was considered the most suitable choice for the primary reference year. It should be noted that some data used in the ABDS (mainly from surveys or epidemiological studies) related to periods earlier than 2018 as this was when the most recent survey or the most relevant epidemiological study was done. In such cases, modelling was required to adjust the counts or rates to 2018.
Although 2018 was used as the reference year of the study, more than 1 year of data was compiled and analysed in some cases to overcome small numbers or to smooth variability. For some estimations, it was also informative to look at trends over time.
There have been 4 previous Australian burden of disease studies with estimates published in ABDS 1996, ABDS 2003, ABDS 2011 and ABDS 2015. While overarching methods for estimating disease burden remained unchanged from the ABDS 2011, revision of some disease-specific methods in ABDS 2015 and ABDS 2018 lead to estimates that differed considerably from the ABDS 2011. Therefore, revision of 2015, 2011 and 2003 estimates were required to provide comparable Australian burden of disease estimates to assess changes over time. These revisions reduce the risk of users making erroneous comparisons between previous 2003, 2011 and 2015 estimates with those produced in ABDS 2018.
Reference populations
All Australian population-based rates for 2018 and 2015 were calculated using populations rebased to the 2016 Census (released 27 June 2017) (ABS 2017).
Population-based rates for 2011 were calculated using final population estimates from the 2011 Census (released 15 December 2016).
The Australian 2001 standard population (published 15 December 2016) was used for all age‑standardisation, as per the Australian Institute of Health and Welfare (AIHW) and ABS standards (ABS 2016).
Age groups
Analysis was done using as fine an age disaggregation as was supported by the data. For fatal burden, YLL were calculated using single year of age. For non-fatal and total burden, construction of YLD (and hence DALY) estimates were based on 5-year age groups of 0, 1–4, 5–9, …, 100+ for the national estimates. Where the available data could not directly support 5 year age groups, modelling was used to derive estimates at the required level of age disaggregation.
The reporting age groups were aligned to fit with existing reporting practices by age and sex to enable comparisons with other data, within the constraints of the quality of the underlying data.
Selection and classification of diseases
The list of diseases and injuries (referred to as the ABDS disease list) – and their organisation into disease groups – forms the analytical framework of the ABDS 2018, and underpins all estimates of deaths, YLL, YLD, DALY and risk-attributable burden. As the burden of each disease is estimated relative to every other disease specified in the study, this list forms the foundation of all analysis and reporting.
The ABDS disease list uses the following hierarchical framework:
Disease groups: 17 disease groups of related diseases or conditions – such as cardiovascular diseases, gastrointestinal disorders, or injuries – and one alternative reporting disease group (nature of injury instead of injury by external cause).
Diseases: 219 specific conditions or sets of conditions such as coronary heart disease, appendicitis, or poisoning, for which estimates of deaths, YLL, YLD, DALY and risk‑attributable burden were produced. These conditions are mutually exclusive (non‑overlapping) including two perspectives for reporting injuries: by external cause or nature of injury.
The ABDS disease list is collectively exhaustive, meaning it covers the full spectrum of disease and injuries (ABDS 2018 list of diseases, conditions and injuries and ICD-10 codes).
Selection of diseases and injuries
The ABDS disease list is an Australian-specific disease list developed to reflect the needs of health reporting and monitoring in Australia. For this study, the ABDS 2015 disease list was reviewed, and modifications made based on a set of inclusion criteria originally developed and applied in the ABDS 2015.
For inclusion in the ABDS 2018 disease list, the condition or injury must meet at least one of the following guiding principles:
Included in other studies’ disease (or cause) lists
Have been included in:
- the GBD study for 2017 or the ABDS 2015 (AIHW 2016a) unless its inclusion in the ABDS 2018 conflicted with other criteria.
Significant burden
- Be of significant burden to at least 1 age group or sex – defined as either more than 25 deaths or more than 500 inpatient events averaged annually over a 4-year period, or as having a ‘significant’ primary care impact, as determined by expert judgement (ensuring the list is not overcome with very minor conditions, for which it might be difficult or costly to assemble data).
Policy interest
- Be of substantial Australian or Indigenous health policy interest – defined as being the focus of current policy or professional attention, or thought to be increasing substantively in impact (which might be signalled by large increases in incidence or prevalence), or
- be the subject of an existing health monitoring activity within Australian or Indigenous populations, or
- be required for the analyses of risk factors that are of high policy interest.
Be able to be measured
- High-quality, relevant and recent epidemiological data needed to be available for at least 2 out of these key epidemiological variables: incidence, prevalence, survival or mortality of/from the condition.
Using these criteria, a final list of 219 diseases, conditions and injuries (including residual conditions – see ‘Residual conditions’ section) were selected and agreed on by the Australian Burden of Disease Expert Advisory Group to form the basis of the ABDS 2018. This includes 13 conditions describing the nature of injury used for alternative reporting (see Injuries for more detail).
As such, the ABDS 2018 disease list will differ from that used in other studies.
Residual conditions
The disease list is collectively exhaustive. Conditions that could not be individually specified are included in a residual category for each disease group. For example, the residual category ‘other musculoskeletal conditions’ are those musculoskeletal conditions not included in arthritis, gout, rheumatoid arthritis and back pain and problems. There are 32 residual (‘other’) categories distributed across the 17 disease groups and another 2 in the alternative reporting group for injuries (nature of injury). In the ABDS 2018, there are new diseases that were previously reported in residual groupings (see Box 2.1).
Box 2.1: Key changes in the list of diseases and injuries for the 2018 Australian study
- A more comprehensive list of diseases,
- disaggregation of pneumoconiosis into silicosis, asbestosis and other pneumoconiosis, and
- the addition of scabies, which was previously reported under skin infections.
For reporting purposes, Lower respiratory infections and influenza, which includes pneumonia, are combined under Lower respiratory infections (including influenza and pneumonia).
Conditions not included as specific diseases in the disease list
There were 3 key reasons for not including some conditions as specific diseases in the ABDS 2018 disease list:
- Scarcity of recent and/or robust data to reliably estimate prevalence in Australia in 2018– these conditions could be incorporated into future burden of disease analyses should more recent or robust data become available. Examples include:
myalgic encephalomyelitis/chronic fatigue syndrome – although believed to be of significant impact, this condition is not monitored in Australia and recent robust data on incidence and/or prevalence are scarce. Although this was included in the ABDS 2003 as a separate disease, the data underpinning these estimates are now outdated. Myalgic encephalomyelitis/chronic fatigue syndrome was not separately estimated in global studies or the New Zealand Burden of Disease Study (NZBDS) 2006 (NZMOH 2013). In this study the burden of this condition is included in ‘other neurological conditions’.
fetal alcohol spectrum disorders (FASD) – although FASD is of policy interest, no national data source was identified. FASD was not separately estimated in GBD global studies but was separately estimated in the NZBDS based on hospitalisations (however, it was noted it would be an underestimate). In the ABDS 2018, the burden of FASD experienced by the child was grouped under the disease ‘brain malformations’ in infant & congenital conditions.
The condition is the result of other underlying causes, or its burden is captured under other sequelae – these conditions do not fit within the mutually exclusive disease structure required for burden of disease analysis. Future analyses of these conditions might be possible by selecting corresponding diseases or sequelae. Examples include:
antimicrobial resistance – antimicrobial resistance includes many types of organisms (for example, staphylococcus) and types of resistance (for example, penicillin). Antimicrobial resistance was not included in previous burden of disease studies. Although it is of policy interest, and there are sufficient data for modelling, its outcomes were captured by other diseases already included in the study (for example, infectious diseases).
septicaemia – this is considered an intermediate, rather than underlying, cause of burden, and its impact was captured through the sequelae and the severity distributions for relevant diseases (for example, selected infectious, neonatal and maternal diseases).
heart failure – this is also considered an intermediate cause of burden, and its impact was captured through the sequelae and the severity distributions for relevant diseases (for example, cardiovascular disease, congenital heart disease).
The condition was conceptualised as a risk factor – these conditions might not have been associated with health loss themselves, but place individuals at greater risk of other health conditions. Their impact is captured as burden attributable to various risk factors. Examples include:
osteoporosis – the health loss from osteoporosis is captured under falls in the injury disease group. The risk factor low bone mineral density was used in this study to estimate the proportion of falls attributable to osteoporosis (see low bone mineral density for more detail)
nutritional deficiencies – in the ABDS 2018, protein-energy deficiency and iron-deficiency anaemia are included as specific nutritional deficiencies in the disease list. Other nutritional deficiencies (such as diet low in calcium) are not included as diseases, but instead as risk factors for other diseases (see iron deficiency and dietary risk factors for more information).
Classification of diseases and injuries
To ensure that the disease list was both comprehensive and mutually exclusive, each included disease and injury had to be carefully defined. To ensure consistency between YLL and YLD estimation, the classification of each disease had to be suitable for both mortality and morbidity components.
As the internationally recognised and definitive set of codes to describe all health conditions, the International Classification of Diseases and Related Health Problems, 10th Revision (ICD‑10) (2010 version) (WHO 2016) was used to broadly define each disease in the disease list. To estimate YLL, ICD-10 classifications were used, but for YLD, classifications were adapted as necessary depending on the data that were available and appropriate for analysis (for example, the Australian modification ICD-10-AM was used for hospital separations data).
See Disease specific methods - morbidity for details of the specific classifications used for each disease group.
Mapping of ICD-10 codes to the disease list
The allocation of more than 12,000 ICD-10 codes to the 219 diseases in the ABDS 2018 disease list was based on the ABDS 2011 (AIHW 2016b) with expansion of some diseases. The ABDS 2011 disease list was informed by the code allocation used by the GBD 2010 study (hereafter referred to as the GBD 2010), the NZBDS 2006 and the ABDS 2003 (Begg et al. 2007).