What could happen by 2030?
Overweight (including obesity) is a major risk factor for cardiovascular disease, type 2 diabetes, some musculoskeletal conditions and some cancers. As the level of BMI increases, so does the risk of developing these conditions.
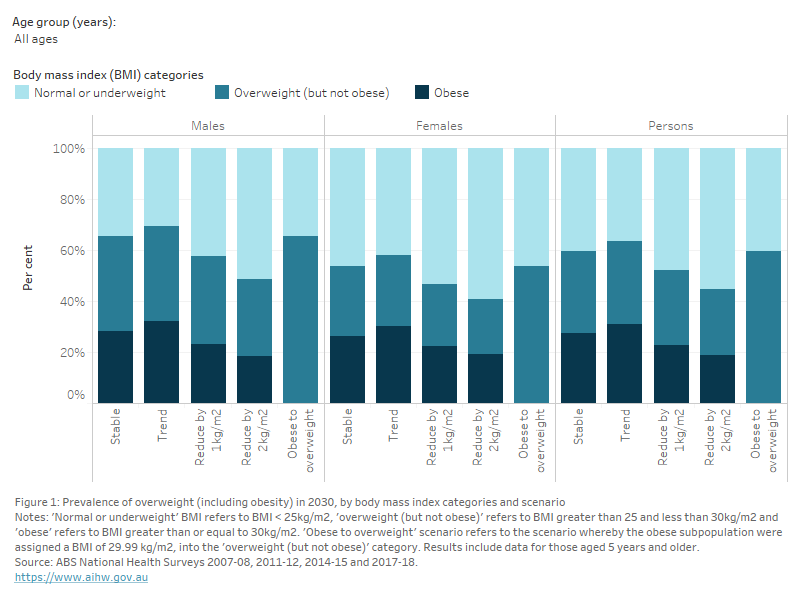
The proportion of Australians estimated to be in each BMI category in 2030 under each scenario is shown in Figure 1. In 2017–18, 60% of Australians aged 5 and over were living with overweight (including obesity). Under the stable scenario, the proportions of the population in each physical activity category would be the same in 2030.
In 2017–18, a greater proportion of males (66%) than females (54%) were living with overweight (including obesity). Based on current trends, both males and females are expected to have greater prevalence (69% and 58%, respectively) of living with overweight (including obesity) in 2030.
If current trends continued (trend scenario), the population expected to be living with overweight (including obesity) in 2030 could increase to 64%.
If everyone in the population at risk of disease due to overweight (including obesity) in 2018 reduced their BMI by 1 kg/m2, and these rates were maintained to 2030, 52% of the population could be expected to be living with overweight (including obesity) in 2030 (a 7.6 percentage-point reduction compared with the stable scenario). If BMI were reduced by 2 kg/m2, this proportion could decrease further to 45%.
In the scenario where the population reduced their BMI by 1 kg/m2, the proportion of males at risk in 2030 could decrease to 58% overweight (including obese) (an 8 percentage-point reduction). For females, this could decrease to 47% (a 7.1 percentage-point reduction). In the scenario where BMI reduced by 2 kg/m2, male and female overweight (including obesity) prevalence could decrease further to 48% and 41%, respectively. In the scenario where the obese population reduced their BMI to overweight (but not obese) status, 66% of males and 54% of females could be overweight (but not obese).
Figure 1: Prevalence of overweight (including obesity) in 2030, by body mass index categories and scenario
This figure presents stacked bar charts of the proportion of males, females and persons aged 5 years or older within each body mass index category (BMI), by scenario. There is also a filter that allows the user to select different age groups to present.
There are three categories of BMI used to categorise the population within each sex: normal or underweight (BMI less than 25), overweight but not obese (BMI between 25 and 30), and obese (BMI greater than or equal to 30).
In 2017–18, the stable scenario, 32% of persons were overweight but not obese, and 27% were obese. If current trends continued to 2030, 33% of persons could be expected to be overweight but not obese, and 31% could be expected to be obese. If the population at risk were to reduce their BMI by 1 unit, 29% would be overweight but not obese, and 23% would be obese.

- Use the drop-down lists at the top of the visualisation to filter the data by age group.
- Hover over the bars or coloured tiles on the charts for additional information.
- The toolbar at the bottom of the visualisation enables users to interact with the data in different ways:
- Undo = Undo the latest filter applied.
- Redo = Redo the latest filter applied.
- Revert = Clears all filters applied and reverts visualisation to default filters.
- Refresh = Connects to the underlying data source and updates the visualisation with any changes in the data (not applicable to this visualisation).
- Pause = Stops the visualisation from updating each time a filter is changed, enabling multiple filters to be changed at once. Clicking ‘Resume’ will update the visualisation according to the selected filters.
- Share = Generates a link that can be shared (note that filters will not be applied when link is shared).
- Download = Allows a downloadable file as either an image (PNG), PDF or PowerPoint file. This is a useful way to save a snapshot of the visualisation to include in a document or presentation.
- Full screen = Displays the dashboard in full screen mode (press Esc to return to original view).