About age-adjusted survival
Cancer data commentary no. 6
Changes in cancer survival rates over time are often used to gain insights into how survival outcomes are changing for people diagnosed with cancer. However, for some cancers the insights may be confounded by changes in the age composition of those diagnosed over time. Age-adjusted survival estimates have been added to Cancer data in Australia (CdiA). These rates enable the assessment of which cancers’ survival rates have been impacted by changes over time in relation to age at diagnosis and therefore may not dependably reflect changes in survival outcomes over time,.
This commentary discusses age-adjusted survival and the impacts age at diagnosis can have on cancer survival rates. The advice provided within this commentary is general advice to help increase the familiarity with the data now being offered. Recommendations are not meant to be prescriptive nor a recommendation of best practice and may change to some extent depending on the investigation being undertaken.
How changes in age of those diagnosed can impact on the overall survival rate
Brain cancer survival time series are used here to illustrate a time series where changes in the age of those diagnosed impacts substantially on the survival rates over time. Figure 1 provides the 5-year relative survival rates over time for brain cancer. The change from 20% in the earliest period to 22% in the latest period could lead to the conclusion that brain cancer survival outcomes haven’t changed much over time.
Figure 1: Five-year relative survival, brain cancer, persons, 1988–1992 to 2013–2017
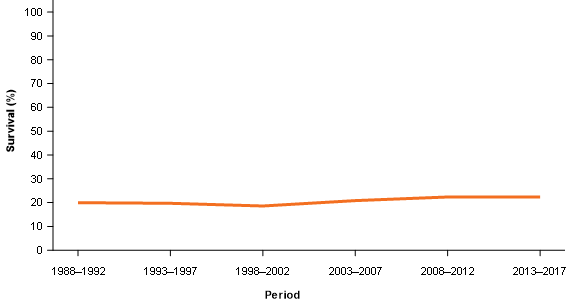
Source: AIHW Australian Cancer Database 2017.
However, while the changes in rates are accurate, this trend may not provide the whole picture. Cancer survival rates often differ considerably by age. On average, older people generally have lower cancer survival rates than younger people. Therefore, if progressively higher proportions of the people diagnosed over time are older then improvements in survival rates may be offset by the greater proportions of older people being diagnosed.
Age adjusted survival rates
Age-adjusted survival rates help to identify the occasions where changes in cancer survival rates over time are impacted by age. CdiA includes “forward looking age-adjusted rates” and “backward looking age-adjusted rates”. They are both age-adjusted rates but the age adjustments have been applied differently. The forward looking and backward looking descriptions are terms used to more simply distinguish between the two.
Age–adjusted survival rates (forward looking)
The forward looking age-adjusted rates detail what the survival rates would be if the age composition of those diagnosed in the base period (that is 1988–1992) remained the same in all future periods. If the age composition of the people diagnosed with brain cancer in 2013–2017 was the same as in 1988–1992, brain cancer survival rates would be 34% in 2013–2017, not 22% as per the unadjusted relative survival rates (Figure 2).
Figure 2: Five-year relative survival and age-adjusted relative survival, brain cancer, persons, 1988–1992 to 2013–2017
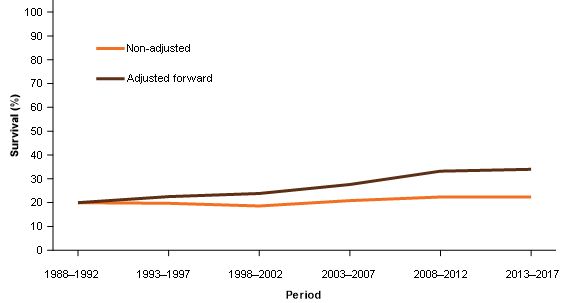
Note: Age composition in each period has been adjusted to equal the age composition of those diagnosed with brain cancer for the 1988–1992 survival period.
Source: AIHW Australian Cancer Database 2017.
Age–adjusted survival rates (backward looking)
However, the age composition of people diagnosed with brain cancer has changed over time. Noting what the rates would have been only indicates that the time series is strongly impacted by changes in age. The backward looking age-adjusted survival rates offer an alternative perspective of the time series in relation to changes in cancer survival outcomes.
The backward looking age-adjusted rates provide what the survival rates for each period would be if the age composition of those diagnosed in the most recent period (2013–2017 in this example) occurred across all previous periods. Using backward looking age-adjusted survival rates, 5-year relative survival rates for brain cancer have doubled between 1988–1992 and 2013–2017 (increased from 11% to 22%) (Figure 3).
Figure 3: Five-year relative survival and age-adjusted relative survival, bain cancer, persons, 1988–1992 to 2013–2017
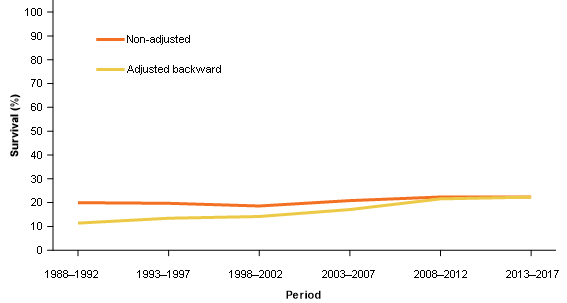
Note: Ages are adjusted to equal the age composition of those diagnosed with brain cancer for the 2013–2017 survival period.
Source: AIHW Australian Cancer Database 2017.
Why produce forward looking and backward looking age-adjusted rates?
In general, we recommend the use of actual (unadjusted) relative survival rates when these are not overly impacted by changes in age composition. Backward looking age-adjusted survival rates are recommended for use when the actual time series does not appear to represent changes in survival outcomes; that is, rate changes over time are influenced substantially by changes in the age at diagnosis. The forward looking age adjusted survival rates are useful to not only identify if changes in age are affecting actual relative survival time series but provide complementary information for the actual relative time series (an example using all cancers combined follows).
The 5-year relative survival rate for all cancers combined has improved from 51% to 70% between 1998–1992 and 2013–2017. The forward looking age-adjusted survival trend suggests that the change in rates would have been more if not for changes in the age composition of people diagnosed with cancer over time (Figure 4).
Figure 4: Five-year relative survival and age-adjusted relative survival, all cancers combined, persons, 1988–1992 to 2013–2017
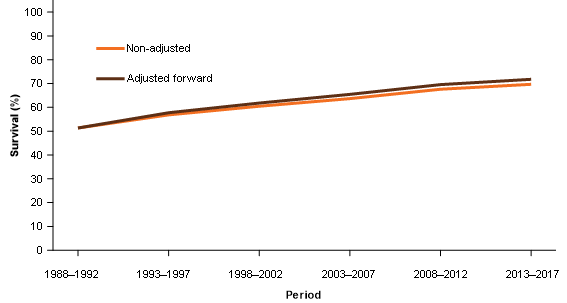
Note: Ages are adjusted to equal the age composition of those diagnosed with brain cancer for the 1988–1992 survival period.
Source: AIHW Australian Cancer Database 2017.
For all cancers combined, the actual relative survival rate doesn’t appear to be greatly impacted by age so it likely provides a reasonable general reflection of improvement in survival outcomes. When discussing changes in actual relative survival rates, the information gained from the forward looking age-adjusted rates allows a more informative description of survival outcomes to be provided, for example:
The 5-year relative survival rate for cancer has improved from 51% to 70% between 1988–1992 and 2013–2017 (Figure 5). Improvements in survival outcomes are slightly under-stated because some improvements have been offset by increasing proportions of older people diagnosed with cancer as the Australian population ages over time (noting that older people generally have lower cancer survival rates).
Figure 5: Five-year relative survival rates, all cancers combined, persons, 1988–1992 to 2013–2017
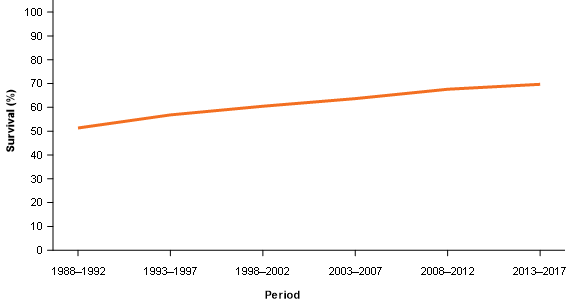
Source: AIHW Australian Cancer Database 2017.
Survival by age group and proportion of people diagnosed by age
Up to this point, we’ve talked about older people having lower survival rates and that, for some cancers, there are proportionally more older people being diagnosed. This will not be true for all cancers so where can this information be found? The cancer survival by age data visualisation includes a couple of other sets of data that allow survival rates by age, and changes in age at diagnosis, to be more simply obtained; these are discussed below.
Cancer survival rates by age group
In 2013–2017, brain cancer 5-year relative survival rates were as high as 68% for people aged between 20 and 39 and as low as 1.4% for people aged over 80 (Figure 6). Similar information is available for all cancers reported within the CdiA and can be located within the Cancer survival by age data visualisation.
Figure 6: Five-year relative survival rates, by age group, brain cancer, persons, 1988–1992 to 2013–2017
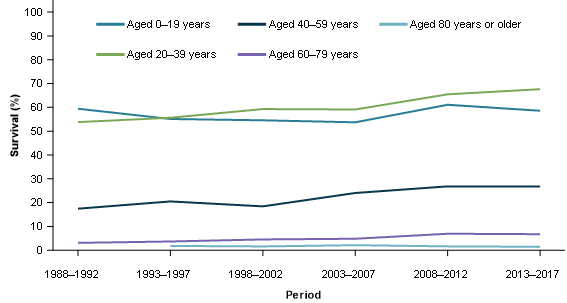
Source: AIHW Australian Cancer Database 2017.
Proportion of cases diagnosed by age
The proportion of people diagnosed with brain cancer who were aged over 80 has increased from 2.3% in 1982 to 12.9% in 2017 (Figure 7). Similar information by 20-year age groups is available for all cancers reported on within the CdiA and can be located within the Cancer survival by age data visualisation.
Figure 7: Proportion of cases diagnosed by age group, brain cancer, persons, 1982 to 2017
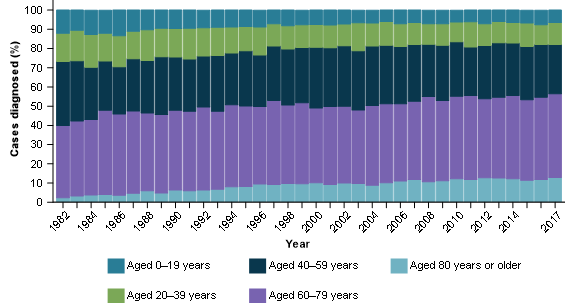
Source: AIHW Australian Cancer Database 2017.
A summary of how the information presented in the cancer survival by age data visualisation can be used together
For brain cancer, we’ve noted that actual relative survival rates are substantially different to the age-adjusted survival rates (Figure 2). The data on the proportion of cases by age indicates that a much greater proportion of people diagnosed with brain cancer are older in more recent periods (Figure 7) and the survival rates are very low for older age groups (Figure 6). In this example, the actual relative survival rates for brain cancer don’t reflect the overall changes in survival outcomes very well because they are impacted by age (Figure 2) and so we present the age-adjusted (backward looking) time series in place of the actual (Figure 3).
For all cancers combined, we’ve noted that actual relative survival rates are reasonably close to the age-adjusted survival rates (Figure 4). This indicates that age hasn’t substantially impacted the survival rates over time so we can simply use the actual relative survival rates to describe the changes over time in survival outcomes (Figure 5). We can also choose to use information from the forward looking age-adjusted rates to provide context that improvements are slightly understated because proportionally more older people are being diagnosed (data not presented here but available within the Cancer survival by age data visualisation).
Concluding points
- Age-adjusted rates (forward looking) are primarily developed to investigate whether the time series for actual relative survival is substantially impacted by changes in age composition but also offer additional context about actual changes in survival outcomes over time.
- Age-adjusted rates (backward looking) are primarily developed to provide an alternative reporting option to actual relative survival rates for instances where the actual relative survival rates aren’t considered to adequately represent changes in survival outcomes over time.
- Age-adjusted rates are intended to provide a more comprehensive understanding of survival outcomes over time for the reported cancer but these rates are not comparable with other cancers (or even the same cancer for a different sex – this is discussed in the next section).
- Both observed and relative age-adjusted survival rates are available within CdiA.
As the length of the survival time series presented in CdiA increases, changes in the age composition of those diagnosed over time has greater potential to influence survival rates. The cancer survival by age data visualisation aims to provide people with information to help understand changes in survival outcomes (and not simply rates) over time.
Future work – age-standardised survival rates
Age-adjusted rates have been added to CdiA to focus on how to better understand how survival outcomes are changing over time for each individual cancer. These age-adjusted survival rates are not directly comparable with actual, or age-adjusted, rates for different cancers (or by sex) because the age composition for one age-adjusted series will more than likely be different to another.
In our future work program, we plan to also produce age-standardised survival rates. These rates will enable comparisons to be made between cancers because they will use the same standard population (and therefore have the same age composition) across different cancers. The age-standardised rates will allow comparisons to be made between cancers but in moving towards this objective, will not capture actual changes over time in survival outcomes for specific cancers as well as age-adjusted survival rates do.
At present, and within the CdiA, to compare survival rates across cancers, comparisons by age group will be the most directly comparable. Comparisons of actual relative survival rates are commonly performed and are useful for general survival comparisons. More precise comparisons between cancers will become available when work on age-standardised survival rates is complete and included within CdiA (tentatively scheduled for the first release of 2022).