Cancer mortality by age visualisation
This cancer mortality visualisation contains two figures. The visualisation presents statistics for the selected cancer and provides information by sex.
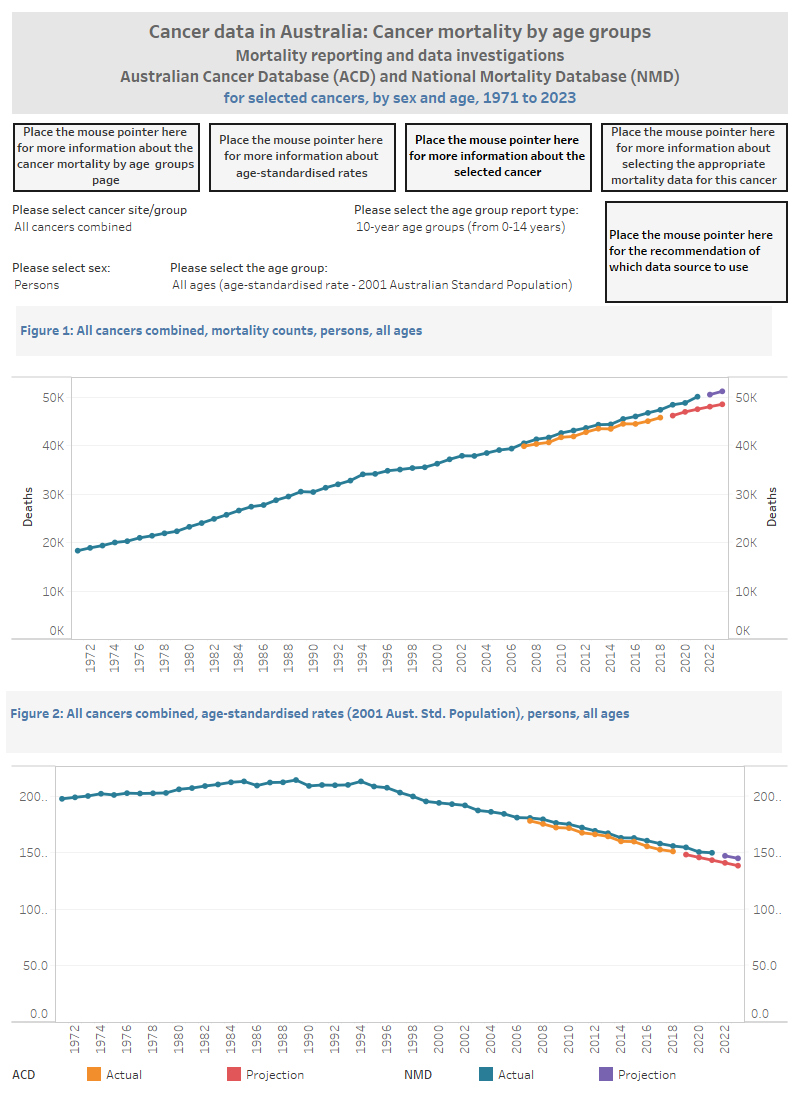
Figure 1 is a line graph that contains information on the number of cancer deaths historically up to the most recent year available for reporting at the time of release. Two series are presented in the graph: a line graph for each of National Mortality Database (NMD)-based and Australian Cancer Database (ACD)-based cancer death counts. Age-group reporting can be selected by 5-, 10-, 15-, 20-, 25-, 30-, 35-, 40-, 45- and 50-year age groups.
Figure 2 is a line graph that contains information on the rate of cancer death historically up to the most recent year available for reporting at the time of release. For a selected age group (other than all ages), the line graph represents the age-specific rate. The crude rate or age-standardised rate can be selected for all ages. Age-group reporting can be selected by 5-, 10-, 15-, 20-, 25-, 30-, 35-, 40-, 45- and 50-year age groups. Two series are presented in the graph: a line graph for each of NMD-based and ACD-based cancer death rates.
The visualisation includes information about many different cancers and the statistics within this visualisation are available in Excel format within the Data section of this report.