Characteristics of children in out-of-home care
On this page:
- How old were children in out-of-home care?
- How many children in out-of-home care have a disability?
- Most children in out-of-home care lived in Major cities
- How many Aboriginal and Torres Strait Islander children were in out-of-home care?
- Box 5.3: Aboriginal and Torres Strait Islander Child Placement Principle
- How many children in out-of-home care were on an order?
- Most children had been continuously in out-of-home care for one year or more
- What are the characteristics of children in long-term out-of-home care?
- References
How old were children in out-of-home care?
Almost one-third (32%) of children in out-of-home care were aged 10‒14, and a similar proportion were aged 5‒9 (30%) (Supplementary table S5.5).
Children in residential care were older than children in home-based care – 87% of children in residential care or family group homes were aged 10 or over. The corresponding proportion of children aged 10 and over in home-based care was 45% (Supplementary table S5.7).
Less than 2% of children in residential care or family group homes were aged under 5, compared with 24% of children in home-based care.
How many children in out-of-home care have a disability?
Children with a disability are a particularly vulnerable group, especially those in the out-of-home care system (Royal Commission into Institutional Responses to Child Sexual Abuse 2016). As disability is a multidimensional and complex concept, differences may exist across jurisdictions in how disability is defined. There are also differences in how information about disability is captured in jurisdictional processes and client information systems.
In 2020–21, data on disability status was available for 63% of children in out-of-home care at 30 June. Of these children, about 30% were reported as having a disability (Supplementary table S5.8).
Most children in out-of-home care lived in Major cities
At 30 June 2021, more than half (54%) of the children in out-of-home care lived in Major cities, and 42% lived in Inner regional and Outer regional areas (based on SA2 or postcode of living arrangement) (Supplementary table S5.9a).
The rates for children in Remote and Very remote areas were more than twice that of those in Major cities for children living in out-of-home care at 30 June 2021 (Supplementary table S5.9b).
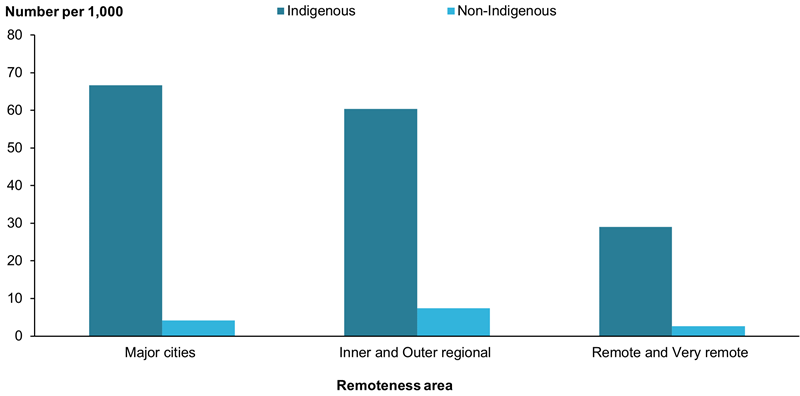
About 8,400 (67 per 1,000) Indigenous children in out-of-home care were living in Major cities, while 1,500 (29 per 1,000) Indigenous children in out-of-home care were in Remote and Very remote areas (Figure 5.4).
The rates for non-Indigenous children in out-of-home care were highest in Inner and Outer regional areas (7 per 1,000). Similarly to Indigenous children, rates were lowest for non-Indigenous children in out-of-home care in Remote and Very remote area (3 per 1,000).
Figure 5.4: Children in out-of-home care, by remoteness area and Indigenous status, 30 June 2021 (rate)
Notes:
- The Remoteness Areas divide Australia into broad geographic regions that share common characteristics of remoteness for statistical purposes. For more information, see Technical notes or ABS 2018.
- See Technical notes for the method used to calculate rates.
Chart: AIHW.
Source: Supplementary data table S5.9b, AIHW Child Protection Collection 2020–21.
How many Aboriginal and Torres Strait Islander children were in out-of-home care?
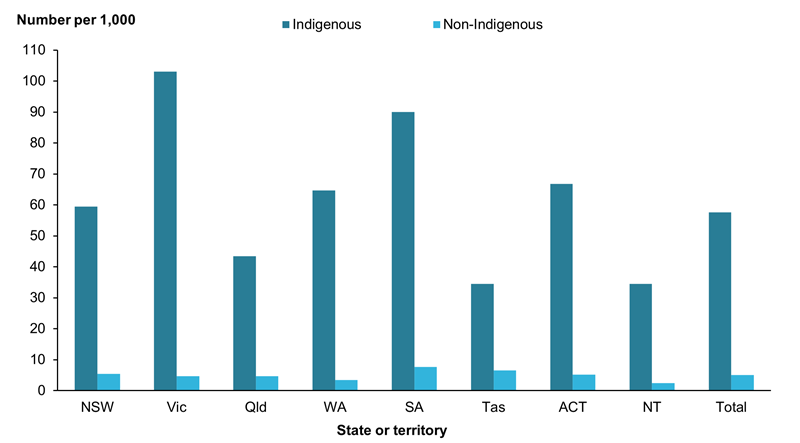
At 30 June 2021, about 19,500 Indigenous children were in out‑of‑home care – a rate of 58 per 1,000 Indigenous children, (Figure 5.5). (Supplementary table S5.11).
Rates for Indigenous children in out-of-home care varied by age groups. Indigenous children aged 5–9 and 10–14 had the highest rates of out-of-home care (65 per 1,000 Indigenous children), while those aged under one had the lowest rate (30 per 1,000) (Supplementary table S5.11).
Figure 5.5: Children in out-of-home care, by Indigenous status and state or territory, 30 June 2021 (rate)
Note: See Technical notes for the methodology used to calculate rates.
Chart: AIHW.
Source: Supplementary data table S5.10, AIHW Child Protection Australia 2020–21.
Box 5.3 describes the Aboriginal and Torres Strait Islander Child Placement Principle, which has been adopted by all jurisdictions in legislation and policy.
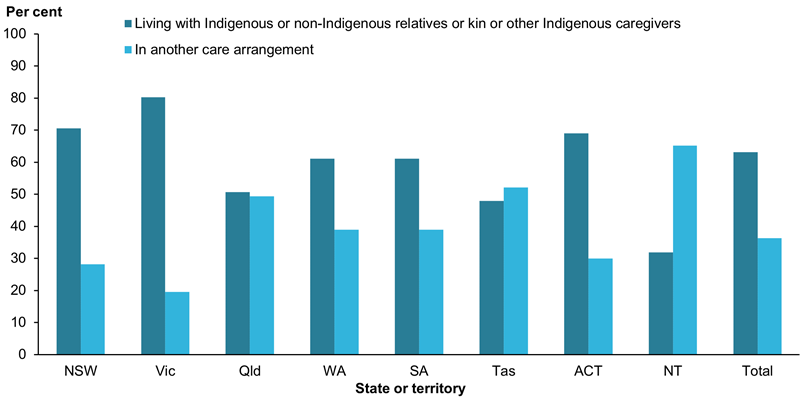
The relatively high proportion of Indigenous children who were placed either with Indigenous caregivers or with relatives in many jurisdictions is most likely due to the Aboriginal and Torres Strait Islander Child Placement Principle (Figure 5.6).
In 2020–21, 63% of Indigenous children were placed with Indigenous or non-Indigenous relatives/kin or other Indigenous caregivers, with some variation across states and territories. This proportion is similar to that reported in previous years.
Box 5.3: Aboriginal and Torres Strait Islander Child Placement Principle
The purpose of the Aboriginal and Torres Strait Islander Child Placement Principle is to ensure Indigenous children remain connected to their family, community, culture, and country.
Core elements include prevention, partnership, placement, participation, and connection.
The Aboriginal and Torres Strait Islander Child Placement Principle outlines a preference for Indigenous children to be placed with other Indigenous people when they are placed outside their family (AIHW 2021).
The principle has the following order of preference for the placement of Indigenous children:
- with the child’s extended family and kinship networks
- within the child’s Indigenous community
- with other Indigenous people.
Where placement options outlined in the principle are not optimal for a child’s safety and wellbeing, the child may be placed in an alternative care arrangement. Usually, this is done only after extensive consultation with Indigenous individuals and/or organisations.
Aboriginal and Torres Strait Islander advocates, community services ministers, and recent Royal Commissions involving child protection matters in Australia have recognised the importance of the Aboriginal and Torres Strait Islander Child Placement Principle and highlighted the need to improve adherence to all 5 elements and monitoring of this.
For further information and to view related indicators, see The Aboriginal and Torres Strait Islander Child Placement Principle Indicators web report.
Figure 5.6: Indigenous children in out-of-home care, by relationship of carer and state or territory, 30 June 2021 (per cent)
Notes:
- From 2019–20, some classifications have changed to better align with the Aboriginal and Torres Strait Islander Child Placement Principle hierarchy. ‘In another care arrangement’ includes children living with non-Indigenous carers who are not relatives or kin, in residential care, in family group homes and children living independently.
- Indigenous children for whom caregiver type was not stated are included in the totals.
- For the Northern Territory, counts of children living with Indigenous or non-Indigenous relatives or kin or other Indigenous caregivers only include children for whom the process of making a placement decision was considered by caseworkers to be in accordance with the Aboriginal and Torres Strait Islander Child Placement Principle. This means there may have been a higher number of Indigenous children living with relatives, kin or other Indigenous caregivers than is presented here. All children who were not considered to be placed in accordance with the Aboriginal and Torres Strait Islander Child Placement Principle are included in the ‘in another care arrangement’ category, regardless of who they were placed with.
Chart: AIHW.
Source: Supplementary data table S5.12, AIHW Child Protection Australia 2020–21.
How many children in out-of-home care were on an order?
At 30 June 2021, nationally, of children in out-of-home care:
- 94% were also on care and protection orders
- 5.6% were not on an order (Supplementary table S5.13).
Most children had been continuously in out-of-home care for one year or more
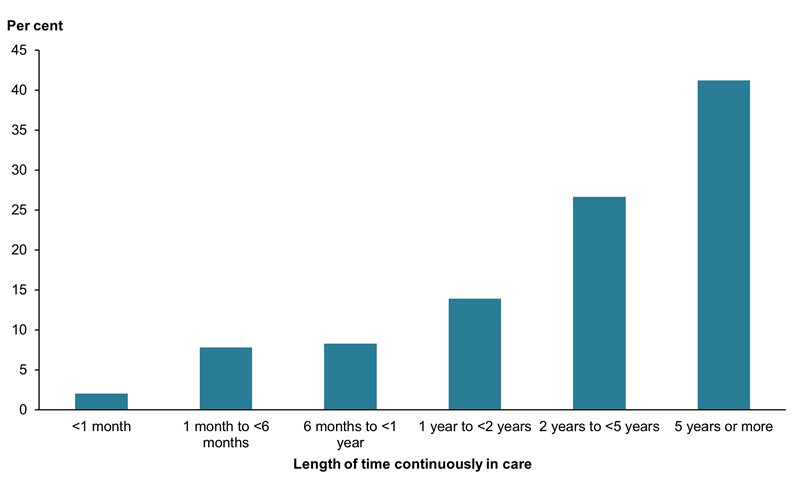
Of approximately 46,200 children in out-of-home care at 30 June 2021, most (82%) had been continuously in out-of-home care for one year or more (Supplementary table S5.14). This included:
- 27% who had been in out-of-home care for 2–5 years
- 41% who had been in out-of-home care for 5 years or more (Figure 5.7).
- About 18% of children had been in out-of-home care for less than one year.
The proportions of Indigenous and non-Indigenous children in out-of-home care who had been continuously in care for one year or more were similar (83% and 81%, respectively).
Figure 5.7: Children in out-of-home care, by length of time continuously in care, 30 June 2021 (per cent)
Note: If a child has a return home or has a break of less than 60 days before returning to the same or different placement, they are considered to be continuously in care during this period.
Chart: AIHW.
Source: Supplementary data table S5.14, AIHW Child Protection Collection 2020–21.
What are the characteristics of children in long-term out-of-home care?
Where there is ongoing case management to achieve a permanent care arrangement, and/or to ensure stability of placement in out-of-home care, some children remain in long-term out-of-home care for 2 years or more. The Permanency outcomes section reports on children who have exited out-of-home care to permanent care arrangements.
Approximately 31,400 (68%) of the 46,200 children in out-of-home care at 30 June 2021 had been in long-term care (2 years or more) (Supplementary table S5.14).
Most (69%) were aged 5–14 and 43% were Indigenous (Supplementary table S5.15).
Of children who had been in care for 2 years or more:
- most (82%) were on long-term guardianship orders
- 5.1% were on short-term guardianship orders
- 9.5% were on other types of orders and
- 3.5% were not on an order (Figure 5.8).
Figure 5.8: Children in long-term out-of-home care, by legal arrangement, 30 June 2021 (per cent)
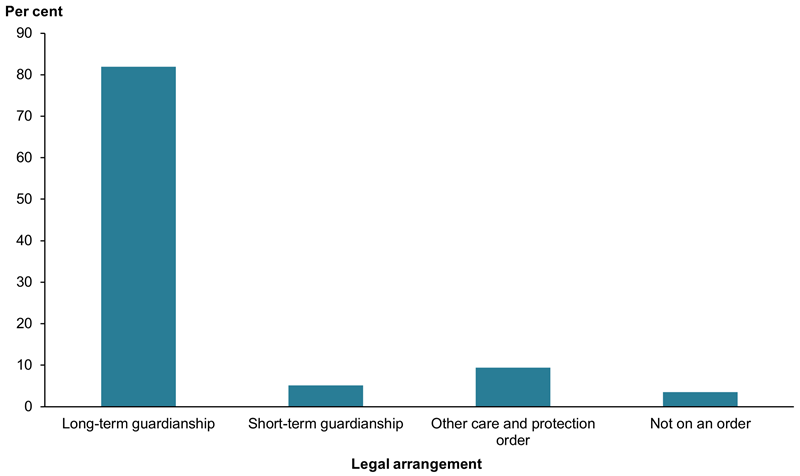
Note: This figure includes only children who had been continuously in out-of-home care for 2 or more years at 30 June 2021.
Chart: AIHW.
Source: Supplementary data table S5.16, AIHW Child Protection Collection 2020–21.
Most children who had been in care for 2 or more years were on long-term guardianship or custody orders living in home-based care with a foster (36%) or relative/kinship carer (38%) (Supplementary table S5.16).
References
For a full list of references, go to References.