Supporting children
On this page
Key findings
- In 2021–22, 36,200 children commenced intensive family support services.
- At 30 June 2022, 61,100 children were on care and protection orders.
- At 30 June 2022, 45,400 children were in out-of-home care.
Child protection departments provide and/or fund a range of services to support children in the child protection system to ensure they have stable, long-term care arrangements. These include:
- intensive family support services
- care and protection orders
- out-of-home care.
Intensive family support services
What is the role of intensive family support services?
Child protection departments may also work to strengthen families with referrals to intensive family support services at any time for advice, education, and support.
In 2021–22, 36,200 children commenced intensive family support services. Of these, about 3 in 5 (63% or 22,800) were aged under 15 (see: Data table 8.1).
These services aim to:
- support parents to care for their children
- prevent separation of children from parents
- achieve reunification where separation has already occurred.
More information on intensive family support services, including government expenditure, can be found in the Report on Government Services 2023.
Care and protection orders
What is a care and protection order?
Care and protection orders are legal orders or arrangements that give child protection departments some responsibility for a child’s welfare. Children can be placed on care and protection orders for various reasons, including:
- having been seriously harmed
- being at risk or significant risk of harm
- having no other care options.
The 3 main categories of legal responsibility conferred by care and protection orders include arrangements where:
- parents retain legal responsibility
- departments are given legal responsibility
- nominated carers are given legal responsibility.
A substantiated notification of maltreatment does not necessarily mean that a child will be placed on an order. In 2020–21, just over one-fifth (22% or 11,200) of children who were subjects of substantiations were subsequently placed on an order within 12 months following substantiation (see: Supplementary data table S4.2).
In cases where parents have made changes to ensure their children’s safety and wellbeing at home, or are prepared to do so, the department may decide an order is unnecessary and consider other options, including:
- referring the family to support services
- putting a safety plan in place
- determining that no further action is needed.
Refer to the Appendices for more information on the different types of care and protection orders.
How many children were on care and protection orders?
At 30 June 2022, 61,100 children were on care and protection orders (11 per 1,000). Of these:
- 24,600 were Aboriginal and Torres Strait Islander children (72 per 1,000 Indigenous children)
- 36,500 were non-Indigenous children (6.8 per 1,000 non-Indigenous children).
Source: Supplementary data table S4.9
In 2021–22, around 10,600 children were admitted to care and protection orders (see: Supplementary data table S4.3). Of these:
- about three-quarters (76% or 8,100) were admitted for the first time (see: Data table 4.2)
- over one-quarter (28% or 3,000) were aged 1–4 years (see: Supplementary data table S4.3).
More (11,700) children were discharged from care and protection orders. Of these, about one-fifth were continuously on an order:
- between one to 2 years (21% or 2,500)
- for 8 years or more (21% or 2,400).
Source: Supplementary data table S4.4
Characteristics of children on care and protection orders
For children who were on care and protection orders at 30 June 2022:
- 2 in 5 (40% or 24,300) were living with relatives/kin in home-based care (see: Supplementary data table S4.5)
- about one-third (33% or 20,100) were aged 10–14 years (see: Supplementary data table S4.6)
- about 3 in 5 (63% or 38,600) were on finalised guardianship or custody orders (see: Supplementary data table S4.10).
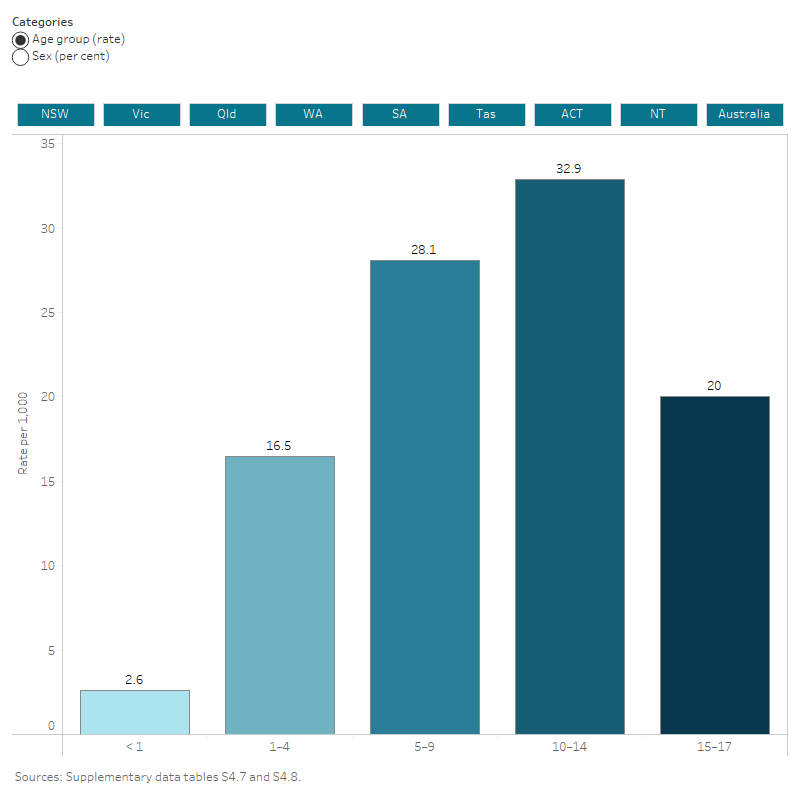
Figure 3: Characteristics of children on care and protection orders, by state or territory, 2021–22
This interactive data visualisation shows the number of children on care and protection orders disaggregated by age group and sex in the year 2021–22. Data are displayed for each state or territory and Australia.
Has the number of children on care and protection orders changed over time?
Between 30 June 2018 and 30 June 2022, the rate of children on care and protection orders remained steady, at around 10 per 1,000 to 11 per 1,000 (see: Supplementary data table T1).
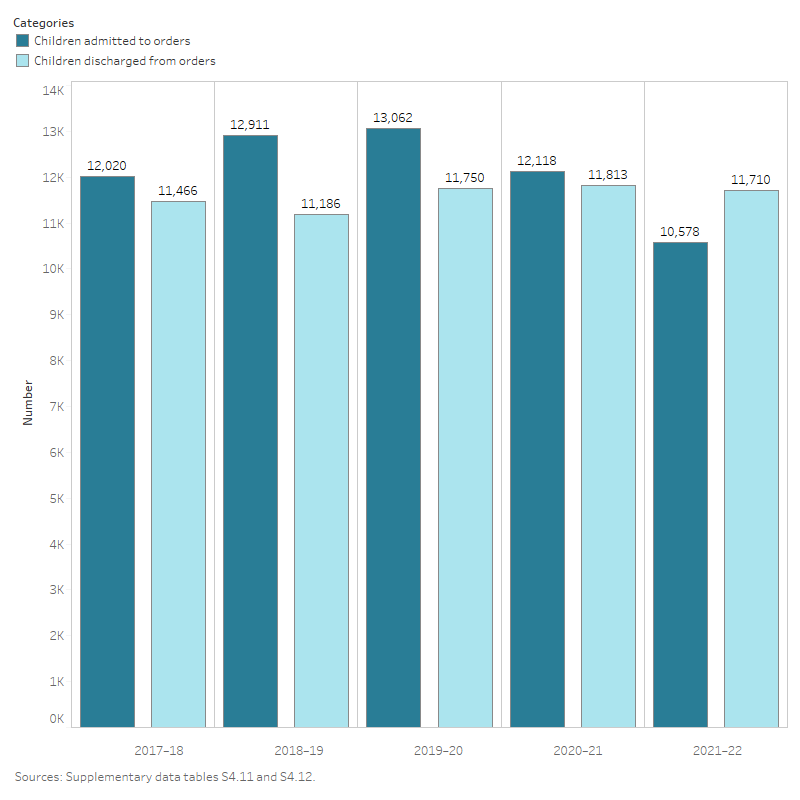
From 2017–18 to 2021–22, the number of children:
- admitted to orders decreased from about 12,000 to about 10,600 children (see: Supplementary data table S4.11)
- discharged from orders remained stable, from about 11,500 to about 11,700 (see: Supplementary data table S4.12).
Figure 4: Children admitted to and discharged from care and protection orders, 2017–18 to 2021–22
This interactive data visualisation shows trends in the number of children admitted to and discharged from care and protection orders between 2017–18 and 2021–22.
Out-of-home care
What is out-of-home care?
Out-of-home care is overnight care for children aged under 18 who are unable to live with their families due to child safety concerns. This includes placements approved by the child protection department for which there is ongoing case management and financial payment (including where a financial payment has been offered but has been declined by the carer). This nationally consistent definition for out-of-home care was implemented in 2018–19.
Out-of-home care includes:
- legal (court-ordered) placements
- voluntary placements
- placements made for the purpose of providing respite for parents and/or carers.
Children are placed in out-of-home care for many reasons, including:
- being the subjects of substantiations and needing a protective environment
- having parents who are incapable of providing adequate care
- needing alternative accommodation during times of conflict
- having parents or carers who need respite.
Consistent with the principle of keeping children with their families where it is safe and appropriate to do so, out-of-home care placements are considered as a last resort.
The national definition for out-of-home care excludes children on third-party parental responsibility orders as the minister or executive no longer has guardianship of children on these orders. However, all states and territories continue to fund carers of children on third-party parental responsibility orders and some (New South Wales, Queensland, South Australia and the Australian Capital Territory) continue to provide some level of case management.
As at 30 June 2022, there were about 10,200 children on third-party parental responsibility orders (see: Supplementary data table T3). Children on third-party parental responsibility orders are considered to have achieved a more permanent arrangement.
Refer to the Appendices for more information on the different types of out-of-home care placements.
How many children were in out-of-home care?
As at 30 June 2022, 45,400 children were in out-of-home care (8.0 per 1,000) (see: Data table 5.1). Of these:
- 19,400 were Aboriginal and Torres Strait Islander children (57 per 1,000 Indigenous children)
- 25,900 were non-Indigenous children (4.8 per 1,000 non-Indigenous children).
Source: Supplementary data table S5.5
In 2021–22, the rates of children admitted and discharged from out-of-home care were around 2.0 per 1,000 (see: Supplementary data tables S5.1 and S5.2). Nationally:
- 10,300 children were admitted to out-of-home care (see: Supplementary data table S5.1)
- 11,000 children were discharged from out-of-home care (see: Supplementary data table S5.2).
Children in the youngest age group (under one) had the highest admission rate of 6.7 per 1,000 compared with less than 2.0 per 1,000 for other age groups (see: Supplementary data table S5.1).
The discharge rate was highest for children in the oldest age group (15–17 years) at 4.4 per 1,000 compared with less than 2.0 per 1,000 for other age groups (see: Supplementary data table S5.2).
Characteristics of children in out-of-home care
For children who were in out-of-home care at 30 June 2022:
- about 90% (40,900) were in home-based care (foster care, relative/kinship care and other home-based care) (see: Supplementary data table S5.3)
- about 3 in 5 (61% or 27,900) children were aged 5–14 years (see: Supplementary data table S5.5)
- disability status was known for 71% (32,300) of children in care, of whom 29% (9,300) had a disability (see: Supplementary data table S5.8)
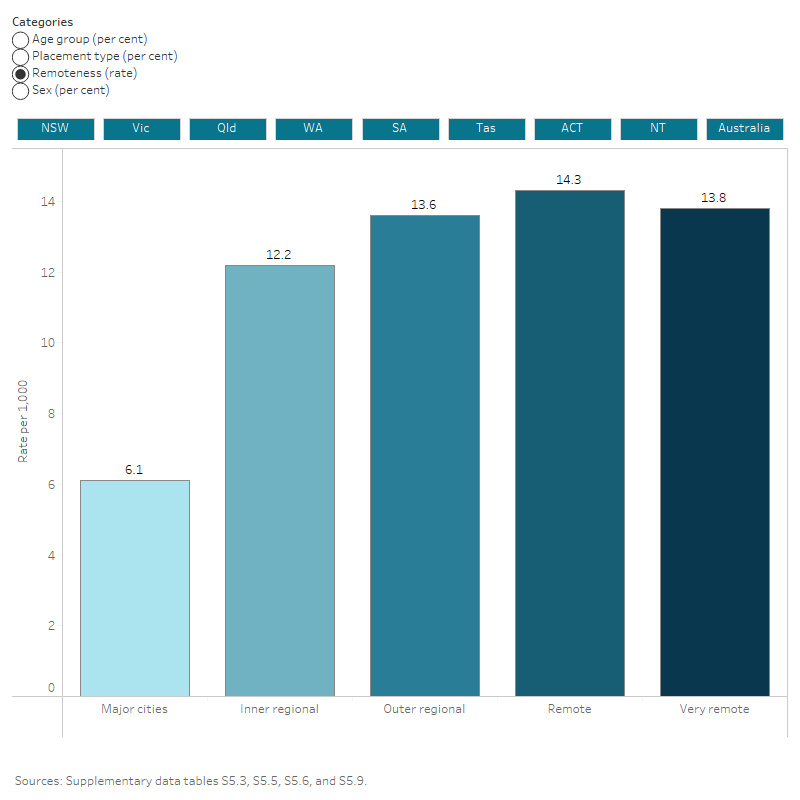
- the rate of children living in inner and outer regional (13 per 1,000) and remote and very remote (14 per 1,000) areas were more than twice that of those living in major cities (6.1 per 1,000) (see: Supplementary data table S5.9)
- most (95% or 42,900) were on a care and protection order (see: Supplementary data table S5.13).
Figure 5: Characteristics of children in out-of-home care, by state or territory, 2021–22
This interactive data visualisation shows the number of children in out-of-home care disaggregated by age group, placement type, remoteness, and sex in the year 2021–22. Data are displayed for each state or territory and Australia.
Characteristics of children in long-term out-of-home care
In 2021–22, 70% (31,700) of children in out-of-home care had been in care for 2 years or more, known as long-term care (see: Supplementary data table S5.15). Of these:
- about 69% (21,800) were aged 5–14 years (see: Supplementary data table S5.15)
- about 81% (25,800) were on a long-term guardianship arrangement (see: Supplementary data table S5.16).
Has the number of children in out-of-home care changed over time?
Between 30 June 2018 and 30 June 2022, the number of children in out-of-home care fluctuated each year, but overall, the rate has remained relatively stable around 8.0 per 1,000 (see: Supplementary data table T1).
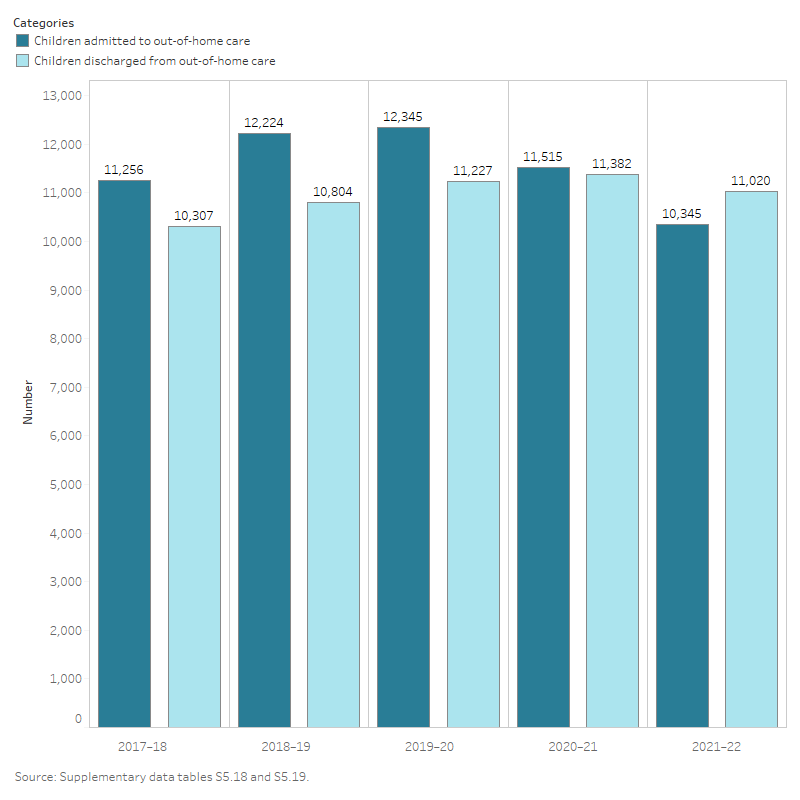
Similarly, from 2017–18 to 2021–22, the number of children admitted and discharged from care changed somewhat each year, but the overall rates remained relatively stable at about 2.0 per 1,000 (see: Supplementary data tables S5.17 and S5.19).
Figure 6: Children admitted to and discharged from out-of-home care, 2017–18 to 2021–22
This interactive data visualisation shows the number of Aboriginal and Torres Strait Islander children who were in out-of-home care at 30 June 2017 to 2022, by caregiver type, and where children are placed with relatives/kin, the relationship of relative or kin carer. Data are displayed for each state and territory and Australia.
What types of carers are there?
Carers are people who have been assessed and approved by the relevant department or agency to provide care in their private households for children in funded and non-funded out-of-home care.
The main types of carers include:
- foster carers who are not related to the child
- relative/kinship carers who are related to or know the child
- long-term guardianship carers who may or may not be related to the child
- respite carers who provide short-term accommodation where the intention is for the child to return to their prior residence (out-of-home care or family home).
How many children were placed in unique carer households?
The reporting of the total number of unique carer households can give insight into the total number of children placed in the household, regardless of the placement type, as some carer households might be approved/authorised to provide more than one care type.
It also allows information about carer households that provide placements other than foster or relative/kinship care to be included in the count.
As at 30 June 2022, there were about 24,200 unique carer households with a placement. Of these:
- more than half (59% or 14,300) had one child placed with them
- about 39% (9,500) had 2–4 children placed with them
- 2.0% (500) had 5 or more children placed with them.
Source: Supplementary data table S7.1
How many children were placed with foster or relative/kinship carers?
As at 30 June, there were about 8,700 foster carer households with one or more children placed with them. Of these:
- about half (51% or 4,400) had one child placed with them
- about 46% (4,000) had 2–4 children placed with them
- 3.3% (300) had 5 or more children placed with them.
Source: Supplementary data table S7.2
As at 30 June, there were about 15,500 relative/kinship carer households with one or more children placed with them. Of these:
- almost two-thirds (64% or 9,900) had one child placed with them
- over one-third (35% or 5,500) had 2–4 children placed with them
- 1.2% (200) had 5 or more children placed with them.
Source: Supplementary data table S7.3
The prevalence of households with multiple child placements might reflect that, in many jurisdictions, priority is given to placing siblings together.
How many children were new or repeat clients?
In 2021–22, 178,000 children aged under 18 years came into contact with the child protection system (see: Data table 2.2). Of these, the majority (70% or 123,000) of children were repeat (which also includes continuing) clients (see: Supplementary data table S2.2).
Repeat clients are children who have previously been in contact with the child protection system. These include children:
- who have been the subject of an investigation
- were discharged from any type of national care and protection order or funded out-of-home care placement (excluding respite placements lasting less than 7 days)
- whose earliest order and/or placement in the current reporting period is part of a preceding continuous episode of care.
Data on new and repeat clients provide some insight into the extent to which new clients, or those with prior involvement, come into contact with the child protection system, and whether this differs across the system components.
In 2021–22:
- More than half (55% or 65,000) of the 119,000 children who were subjects of investigations for alleged child maltreatment notifications were repeat clients.
- Most (96% or 69,300) of the 72,300 children on a care and protection order were repeat clients.
- Most (95% or 53,200) of the 55,800 children placed in out-of-home care were repeat clients.
Source: Supplementary data table S2.2
Refer to the Appendices for more information on the child protection system.
How safe were children in care?
Sometimes children in out-of-home care can be the subject of further abuse, for example, by their carer or another person in the household or care facility.
In 2021–22, 1,200 children were subjects of substantiations of abuse in care.
Source: Unpublished data from the AIHW Child Protection Collection
More information on the safety and abuse of children in care will be included in the report over the coming months.
How were children supported to transition out of care?
To support children to find stable long-term care arrangements, child protection departments undertake permanency planning for children in out-of-home care.
Permanency outcomes include:
- reunifying children with their families
- placing children in a third-party care arrangement
- placing children on long-term guardianship or custody orders
- adoption.
In 2021–22, 9,000 children exited out-of-home care to a permanency outcome.
Source: Unpublished data from the AIHW Child Protection Collection
More information on children’s transition from out-of-home care will be included in the report over the coming months.
References
HREOC (Human Rights and Equal Opportunity Commission) (1997), Bringing them home: Report of the national Inquiry into the Separation of Aboriginal and Torres Strait Islander Children from Their Families, HREOC, accessed 6 February 2023.