Early childhood education and care
Data updates
25/02/22 – In the Data section, updated data related to early childhood education and care are presented in Data tables: Australia’s children 2022 - Education. The web report text was last updated in December 2019.
Key findings
- In 2017, around 3 in 5 children aged 0–4 (925,900 children) usually attended some form of child care.
- In 2017, nearly 296,000 (90%) of eligible children were enrolled in a preschool program in the year before full-time school.
Quality early childhood education and care assists with healthy early childhood development, while supporting workforce participation of parents/caregivers. Child care can be formal or informal. The formal early childhood education and care sector includes centre-based child care and preschool services (Productivity Commission 2016) (Box 1).
There is growing evidence that quality early childhood education and care gives children developmental opportunities and improves school readiness (Melhuish 2012; OECD 2017; Warren et al. 2018). Children who arrive at school ‘ready’ are more likely to do well in future years (see Transition to primary school).
Preschool programs can help children acquire school readiness by developing learning-related skills, such as the ability to:
- express thoughts
- adapt appropriate behaviours
- control impulsivity
- remain concentrated
- show curiosity, persistence and develop social competence (Melhuish 2012).
Matched data from the Australian Early Development Census (AEDC) showed a positive association between preschool experiences and children’s development at school entry, especially for developmental domains related to learning (Warren et al. 2018). In 2015, children who received some Early Child Education and Care (ECEC) were less likely to be developmentally vulnerable on 1 or more domains (19.9 %), compared to children who did not receive any ECEC (38.5%) (SCRGSP 2019).
Research using data from LSAC found that, after controlling for socio-demographic characteristics, there was a significant positive association between attendance at preschool programs and Year 3 NAPLAN results (Warren & Haisken-DeNew 2013). The 2011 cycles of Trends in International Mathematics and Science Study (TIMSS) and Progress in International Reading Literacy Study (PIRLS) found that Year 4 students who had attended at least 1 year of pre-school had higher achievement than those who attended less than 1 year of pre-school (for reading achievement) or did not attend at all (for mathematics and science achievement) (Thomson et al. 2012).
Although beneficial for all children, preschool programs can help reduce the educational gap between children from vulnerable families and more affluent families (Melhuish 2012).
Box 1: Definitions of child care and preschool
Child care
Child care can be formal or informal:
- Formal child care is regulated care away from the child’s home. The main types included in the CEaCS survey are long day care, before and/or after school care, family day care and occasional care (ABS 2018a). Before 2005, preschool was also considered a type of formal care (AIHW 2019).
- Informal paid or unpaid care is non-regulated care arranged by a child’s parent or guardian, in the child’s home or elsewhere. It includes care by grandparents, (step) brothers and sisters or other relatives (including a parent living elsewhere) and other people such as friends, neighbours, nannies or babysitters and other organisations (for example, crèche at gyms and health centres) (ABS 2018a).
Preschool
Preschool services deliver a preschool program. Preschool programs:
- are structured, play-based learning program, delivered by a qualified teacher, aimed at children in the year or 2 before they start full-time schooling (SCRGSP 2019).
- can be delivered within a long day care centre, or in a stand-alone facility.
The range of service types offered differs across states and territories and between service providers.
The age of entry to preschools varies slightly across jurisdictions but is generally around 4 years (Table 1).
|
State/territory |
Program name |
Age of entry—preschool program in year before full-time schooling |
Age of entry—school |
|---|---|---|---|
|
NSW |
Preschool |
Generally aged 4 and 5 |
5 by 31 July |
|
Vic |
Kindergarten |
4 by 30 April |
5 by 30 April |
|
Qld |
Kindergarten |
4 by 30 June |
5 by 30 June |
|
WA |
Kindergarten |
4 by 30 June |
5 by 30 June |
|
SA |
Preschool |
4 by 1 May |
5 by 1 May |
|
Tas |
Kindergarten |
4 by 1 January |
5 by 1 January |
|
ACT |
Preschool |
4 by 30 April |
5 by 30 April |
|
NT |
Preschool |
4 by 30 June |
5 by 30 June |
Source: SCRGSP 2019.
In Australia, preschool attendance is not compulsory. However, in recognition of its benefits, the Australian Government and state and territory governments have, since 2008, committed to increase participation in high-quality education and care under a series of agreements on Universal Access to Early Childhood Education and Care in the year before full-time school (Department of Education 2019).
While the benefits of attending preschool in the year before full-time school are widely accepted, it has been suggested that attending high-quality preschool programs for longer may be even more beneficial (Warren et al. 2018). Australia does not currently have a national approach to this but some states and territories are introducing subsidised preschool programs for all 3 year olds.
Closing the gap in preschool enrolments for Aboriginal and Torres Strait Islander children was a key priority of the Closing the Gap framework established by the Council of Australian Governments (COAG) in 2008 (PM&C 2019). In 2017, the target to have 95% of Indigenous children aged 4 enrolled in early childhood education (by 2025) was on track (PM&C 2019) (See also ‘Are preschool enrolment rates the same for everyone?’).
Box 2: Data sources for early childhood education
Child care data are sourced from the ABS Childhood Education and Care Survey (CEaCS) which has been conducted every 3 years since 1969 (until 2005 it was known as the Child Care Survey). The latest data are for 2017. The survey also covers early childhood education, and learning activities for children aged under 13.
Preschool data are sourced from the SCRGSP’s (Steering Committee for the Review of Government Service Provision) Report on government services. The SCRGSP’s report uses ABS Preschool Education Australia, which is compiled from administrative data in the National Early Childhood Education and Care Collection. The collection includes data about services and children (enrolment and attendance). Data on child care workers were included in some previous cycles of the collection. They were sought for 2018 but were sometimes incomplete or not yet available.
Data on the quality of ECEC services are sourced from the Australian Children’s Education & Care Quality Authority’s (ACECQA) National Quality Framework (NQF) snapshots.
How many children aged 0–4 usually attend child care?
In 2017, around 3 in 5 children aged 0–4 (59% or 925,900 children) usually attended some form of child care:
- 30% (less than 1 in 3) for infants under the age of 1
- 62% (2 in 3) for 1 year olds
- 72% (almost 3 in 4) for 2 year olds (ABS 2018a).
Of the informal care types, grandparents were the most frequently used source across all ages 0–4. While almost 1 in 5 (20%) infants under the age of 1 were usually in the informal care of grandparents, this increased to 1 in 3 (33%) children aged 1, and around 30% of 2 year olds (ABS 2018a). The increase in the proportion of 4 year olds who did not usually attend care is likely due to the use of preschool at this age. Preschool is not included as formal care (Box 1).
Figure 1: Use of child care by age, 2017
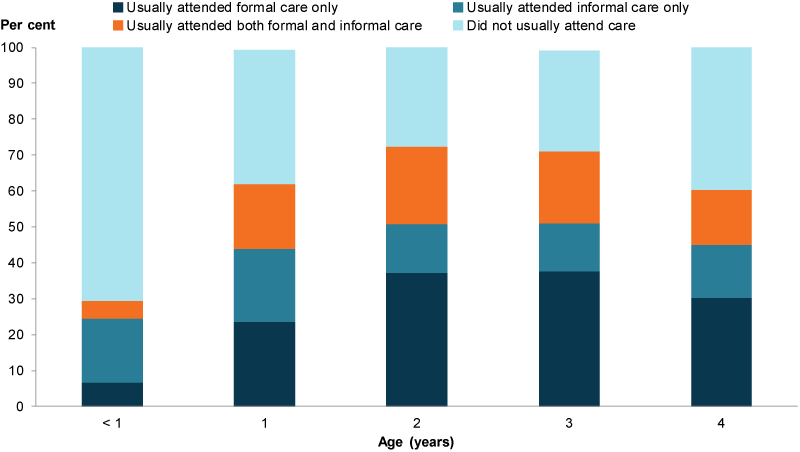
Chart: AIHW. Source: ABS 2018a.
Has the use of child care changed over time?
Between June 1999 and June 2017 there was little change in the proportion of children aged 0–4 attending some form of child care in the week before the survey:
- 55% in June 2011 and June 2014
- 60% in June 2005.
However, while informal care halved between 1999 and 2017 (32% to 15%), formal care increased by around 70% (16% in 1999 to 27% in 2017). Children who attended a mix of formal and informal care showed a small increase (11% in 1999 to 14% in 2017) (Figure 2).
Figure 2: Children aged 0–4 who attended formal and/or informal care in the previous week, 1999–2017
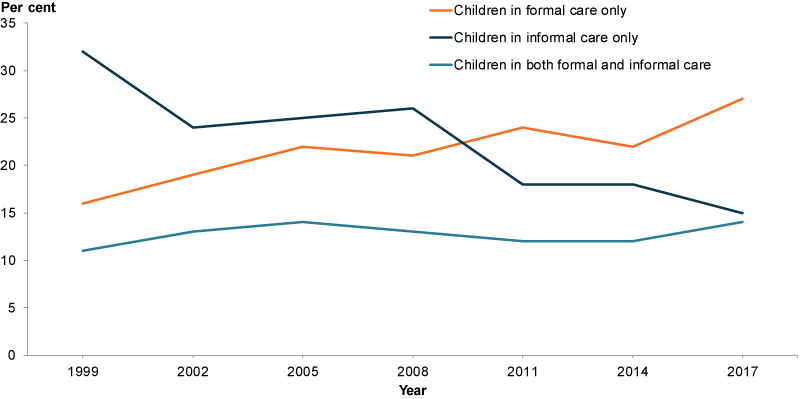
Chart: AIHW. Source: ABS 2018a.
How many children are enrolled in preschool?
In 2017, nearly 296,000 (90%) of eligible children were enrolled in a preschool program in the year before full-time school (YBFS) (SCGRSP 2019):
- 80% (236,000) were age 4
- 19% (56,000) were age 5
- 1.2% (3,500) were age 3
- more were boys (over 155,000 boys compared to around140,000 girls) (ABS 2018b).
- 96% were enrolled for 15 hours per week or more (SCGRSP 2019).
Due to data availability, this section focuses on 2016 and 2017; however, some data on preschool enrolment in 2018 are included (Box 3).
Box 3: Preschool enrolment in 2018
In 2018, nearly 297,000 children were enrolled in a preschool program in the YBFS (ABS 2019), an increase from nearly 296,000 in 2017 and around 288,000 in 2016 (SCRGSP 2019).
As population estimates for the single year cohort for the population that will transition to full-time schooling in the following year was not available, the proportion of children enrolled in the state-specific YBFS cannot currently be calculated. For more information, see Technical notes below.
Have preschool enrolment rates changed over time?
While the number of children enrolled in a preschool program in the YBFS increased between 2016 and 2017 (from around 288,00 to around 296,000) the proportion decreased from 92% to 90% (SCGRSP 2019).
Are preschool enrolment rates the same for everyone?
In 2017, the proportions of children enrolled in a preschool program aged in the YFBS from priority group populations compared with the representation of these priority groups aged 4–5 in the community (that is the Australian child population) were as follows:
- In Inner and outer regional areas, the proportion was a little higher (27%) than the representation in the community (26%) (Figure 3).
- For children living in Remote and very remote areas, the proportion was almost the same (2.3%) as the representation in the community (2.4%).
- For children in the lowest socioeconomic areas (the most disadvantaged), the proportion was a little lower (17%) than the representation in the community (19%).
Figure 3: Proportion of children enrolled in a preschool program in the year before full-time school by priority population groups, compared with children aged 4–5 in the community, 2017
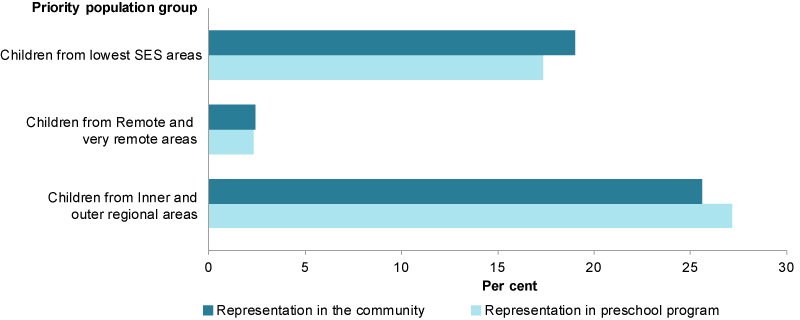
Chart: AIHW. Source: SCRGSP 2019.
Closing the Gap target for preschool enrolment
The COAG Closing the Gap target to have 95% of Indigenous 4 year olds enrolled in early childhood education (by 2025) was on track for 2017 (PM&C 2019). Progress against this target is measured by the proportion of children enrolled in early childhood education in the year before they start full-time school (PM&C 2019).
In 2017, the proportion of Indigenous children enrolled in a preschool program in the YBFS was higher than non-Indigenous children (95% or 15,700 Indigenous children compared with 90%) or 280,000 non-Indigenous children) (SCRGSP 2018).
The proportion of Indigenous children enrolled in a preschool program in the YBFS increased between 2016 (91%) and 2017 (95%). In comparison, the proportion for non-Indigenous children declined slightly (92% to 90%) (PM&C 2019).
How many early childhood education services have a quality rating?
The NQF provides a national approach to regulation, assessment and quality improvement for ECEC and outside school hours care services. Services approved and regulated under the NQF, include child care services (long day care, family day care, and outside school hours’ care) and preschool services.
The National Quality Standard comprises 7 quality areas:
- educational program and practice
- children’s health and safety
- physical environment
- staffing arrangements
- relationships with children
- collaborative partnerships with families and communities
- governance and leadership.
As at 31 March 2019, there were 15,902 ECEC services were NQF approved, of which 94% (14,897) had received a quality rating. Around:
- 47% (7,049) met the NQS
- 31% (4,670) exceeded it
- 0.3% (47 services) received a rating of excellent (ACECQA 2019).
Data limitations and development opportunities
Under the National Partnership on Universal Access to Early Childhood Education, the Australian Government has provided funding to support further data and analytical work to build the domestic evidence base, especially to:
- identify the children not enrolled or have low attendance
- better understand the factors contributing to low participation (Department of Education 2019).
Where do I find more information?
For more information on:
- preschool enrolment for Indigenous children, see: Indigenous children
- child care, see: ABS 4402.0—Childhood Education and Care
- preschool data by state and territory, see: Early childhood education in Children’s Headline Indicators and ABS 4240.0—Preschool education
- children attending Australian Government Child Care Benefit-approved child care services, parental costs for ECEC services and ECEC staff qualifications. see: Review of Government Services, Chapter 3: Early Childhood Education and Care
- ratings of ECEC services, see: ACECQA’s NQF snapshots