The transition to primary school
Key findings
- Between 2009 and 2018, the proportion of children developmentally vulnerable on 1 or more Australian Early Development Census (AEDC) domains decreased from 24% to 22%.
- The proportion of children developmentally vulnerable on 2 or more AEDC domains also decreased from 12% to 11%.
Starting school is a key milestone in a child’s life, which can be exciting and challenging. The transition to primary school requires a significant adjustment to a new environment, with less personalised relationships, a different education and care model, and more children of many different ages (CCCH 2008).
A range of individual, family and community factors can affect a child’s readiness for school (Edwards et al. 2009). Individual factors include early cognitive ability and temperament while family characteristics include parenting style, the home learning environment, maternal education and family income. Parenting and the home environment also mediate the relationship between financial disadvantage and school readiness. While community-level variables appear to have a smaller impact on children’s school readiness, child care and preschool attendance have been found to affect early child development (Edwards et al. 2009).
The AEDC is a national measure of how children have developed by the time they start school (Box 1). A child’s development when they start school is strongly associated with how well they continue through primary school.
Box 1: Data source on school readiness: The Australian Early Development Census
The AEDC is a population measure of children’s development as they enter the first year of full-time school. It is considered a measure of how well children and families are supported from conception through to school age (AEDC 2019a).
Data are collected every 3 years using an Australian version of the Early Development Instrument (avEDI), a teacher-completed checklist developed in Canada.
The first Australian collection was in 2009 with subsequent collections in 2012, 2015, 2018. Participation is voluntary with data collected through the cooperation of parents and the active involvement of government, Catholic and independent school sectors across Australia (AEDC 2019a).
These 5 AEDC domains are considered crucial constructs that can affect a child’s readiness to make a successful transition to primary school:
- physical health and wellbeing
- social competence
- emotional maturity
- language and cognitive skills (school-based)
- communication skills and general knowledge.
Results on AEDC domains group children into these categories:
- developmentally vulnerable (below 10th percentile)
- developmentally at-risk (between 10th and 25th percentile)
- on track (between 25th and the 50th percentile, and above 50th percentile)
Note that the cut-off scores were established in the first (2009) data collection cycle (AEDC 2019a).
Domain information about children with special needs is not included in AEDC results because of this group’s already identified substantial developmental needs.
AEDC results also include summary measures of children developmentally vulnerable on 1 or more domains and on 2 or more domains. These children are considered at especially high risk developmentally.
In 2018, the AEDC collected data on almost 309,000 children in Australia, representing more than 96% of children in their first year of full-time school (AEDC 2019a).
In 2015, children who received some Early Childhood Education and Care (ECEC) were less likely developmentally vulnerable on 1 or more domains (19.9%), compared to children who did not receive ECEC (38.5%) (SCRGSP 2019).
Research has found that children vulnerable on 1 or more of the Early Development Instrument domains at age 5 were more likely in the bottom 20% of all student scores on the NAPLAN assessments in years 3, 5 and 7 than children not vulnerable on any Early Development Instrument domain (AEDC 2014).
The AEDC has also been used to construct the Multiple Strength Indicator (MSI) which focuses on children’s strengths when they start school (see Box 2).
Box 2: The Multiple Strength Indicator
The Multiple Strength Indicator (MSI) is a positive measure of children’s developmental strengths of what is going well for children when they start their first year of full-time school. It is constructed using data from the AEDC.
The key difference between the MSI and the AEDC summary indicators on children’s vulnerability discussed in this section is that the MSI focuses on children’s strengths when they start school whereas vulnerability indicators show if children are facing challenges in their development (AEDC 2019b). The MSI is a summary indicator that could be used to complement the current suite of deficit-based indicators reported from the AEDC (AEDC 2019b).
The MSI focuses on social and emotional developmental strengths such as:
- self-control
- pro-social skills
- respectful behaviour towards peers, teachers and property
- curiosity about the world.
The indicator also identifies children who have advanced literacy skills, a particular interest in reading, numeracy and memory, and very good communication skills (AEDC 2014).
Children can be classified into 3 groups as having:
- emerging strengths—children with scores falling below the 25th percentile.
- well-developed strengths—scores falling between the 25th and 50th percentile.
- highly developed strengths—scores above the 50th percentile (AEDC 2014).
Results found that the MSI provides complementary information for children who were developmentally vulnerable. In 2009, almost one-quarter of children (24%) who were developmental vulnerable on 1 or more AEDC domains had well developed (19.6%) or highly developed strengths (4.7%) based on the MSI (Gregory & Brinkman 2016).
A comparison of results from the 2009, 2012 and 2015 AEDC cycles showed at the national level, a decrease in the percentage of children with emerging strengths (24% to 22%) and well developed strengths (24% to 23%) and an increase in percentage of children with highly developed strengths (52% to 56%). However, if these differences are statistically significant has not been determined (Gregory & Brinkman 2016).
The MSI has good predictive validity for academic achievement. Children with strengths in more areas at school entry were found to be less likely to score at or below the national minimum standard in the Year 3 to Year 9 NAPLAN (AEDC 2014b).
Because of the broad range of skills, competencies and character strengths measured in the indicator (such as self-control, peer relationships, love of learning, and curiosity), the indicator would be expected to predict a wide range of (non-academic) life success measures (AEDC 2014b).
For more information on a positive measure of mental health competence that also draws on AEDC data, see the Social and emotional wellbeing section in the Health domain.
How many children are developmentally vulnerable at school entry?
In 2018, the majority of Australian children were doing well, with almost 4 in 5 children (78%) on track across all AEDC domains; however:
- 22% of children (63,400 or 1 in 5) were developmentally vulnerable on 1 or more domains at school entry
- 11% (32,400) were vulnerable on 2 or more domains (Figure 1).
Boys were more likely developmentally vulnerable than girls on:
- 1 or more domains (28% compared with 15%) and
- 2 or more domains (15% compared with 6.7%).
Figure 1: Children developmentally vulnerable on 1 or more and 2 or more AEDC domains, by sex, 2018
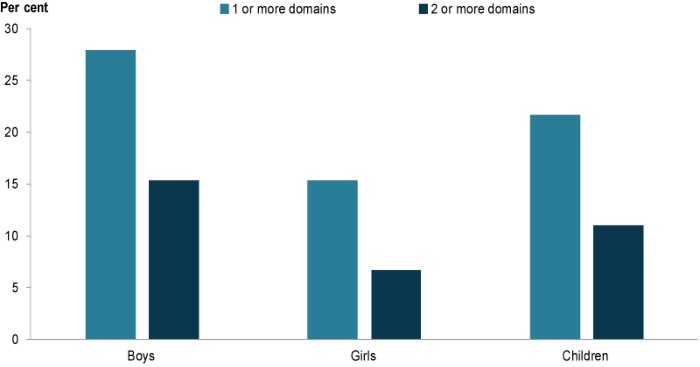
Chart: AIHW. Source: AEDC 2019a.
Looking at individual AEDC domains, boys were more likely than girls to be developmentally vulnerable on each. The difference was greatest for emotional maturity. On this domain, boys were more than 3 times as likely as girls to be developmentally vulnerable (13% compared with 3.8%).
Figure 2: Children developmentally vulnerable on each of the 5 AEDC domains, by sex, 2018
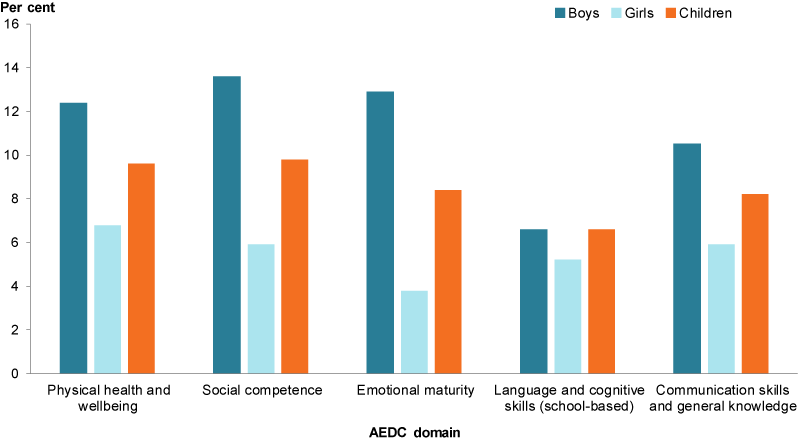
Chart: AIHW. Source: AEDC 2019a.
Has the rate of developmentally vulnerable children changed over time?
Between 2009 and 2018, the proportion of children developmentally vulnerable on 1 or more AEDC domains decreased from 24% to 22%. The proportion of children developmentally vulnerable on 2 or more also decreased, from 12% to 11%.
Figure 3: Children developmentally vulnerable on 1 or more AEDC domains, and 2 or more domains, 2009–2018
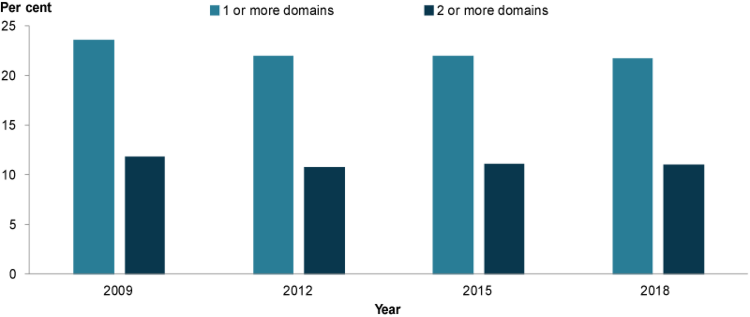
Chart: AIHW. Source: AEDC 2019a.
The largest change from 2009 to 2018 was in the language and cognitive skills (school-based) domain, with developmental vulnerability decreasing from 8.9% to 6.6%. However, most of this decline occurred between 2009 and 2012 (6.8%). Developmental vulnerability in the communication skills and general knowledge domain decreased from 9.2% in 2009, to 8.2% in 2018 and in the emotional maturity domain from 8.9% in 2009 to 8.4% in 2018.
The social competence and physical health and wellbeing domains had small fluctuations between 2009 and 2018. In both, the percentage of children developmentally vulnerable was higher in 2018 (9.8% and 9.6%) compared to the baseline (9.5% and 9.3%, respectively). In both, the percentage of children developmentally vulnerable was highest in 2015 (AEDC 2019a).
|
Physical health and wellbeing |
Social competence |
Emotional maturity |
Language and cognition |
Communication and general knowledge |
|---|---|---|---|---|
|
▲ |
▲ |
▼ |
▼ |
▼ |
Are rates of developmental vulnerability the same for everyone?
The proportion of children with a language background other than English (LBOTE) who were developmentally vulnerable on 1 or more AEDC domains was 1.3 times as high as for children who spoke English only (26% compared with 20%) (Figure 4).
Children from LBOTE and English-only backgrounds can be proficient or not proficient in English. There was almost no difference between LBOTE children proficient in English and children who spoke English only (and were proficient in English)—18.1% and 18.2%, respectively.
For children with a LBOTE or English-only background, who were not proficient in English, the proportion developmentally vulnerable on 1 or more domains was above 90%. The vast majority of these children were developmentally vulnerable on the communication skills and general knowledge domain (AEDC 2019a).
Children living in Very remote areas (46%) were more than twice as likely to be developmentally vulnerable on 1 or more AEDC domains as children in Major cities (21%) (Figure 4). The domain with the greatest differences in vulnerability between children in Very remote areas and those in Major cities was the language and cognitive skills domain (29% compared with 5.8%).
The proportion of children living in the lowest socioeconomic areas who were developmentally vulnerable on 1 or more domains was twice that of those in the highest socioeconomic areas (32% compared with 15%) (Figure 4). The domain with the greatest differences was the language and cognitive skills domain (13% compared with 2.8%).
Differences were also evident between Indigenous and non-Indigenous children (41% compared with 20%), most notably in the language and cognitive skills domains (21% compared with 5.7%) (Figure 4). However, the proportion of Indigenous children vulnerable on 1 or more domains for Indigenous children decreased from 47% in 2009 to 41% in 2018 (AEDC 2019a).
Figure 4: Children developmentally vulnerable on 1 or more AEDC domains, by selected population groups, 2018
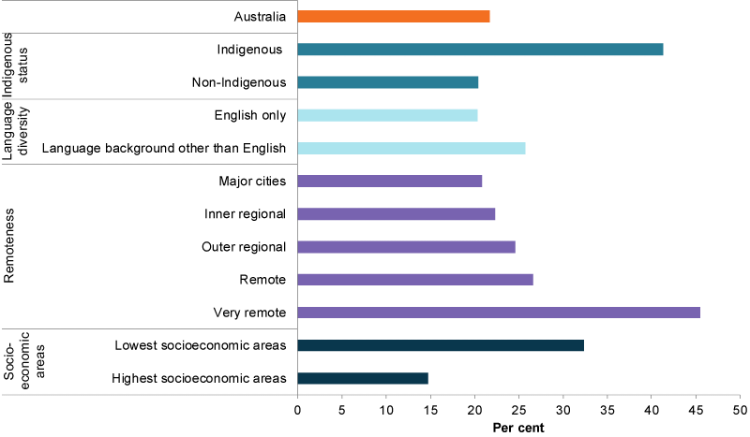
Chart: AIHW. Source: AEDC 2019a.
Children in contact with the child protection system
Data from the South Australian Early Childhood Data Project (SA ECDP) indicated that in South Australia, children who had contact with child protection agencies were more likely to be developmentally vulnerable on 1 or more domains at age 5 on school entry compared with children who did not have contact.
As the level of contact with the child protection system increases, so does the prevalence of developmental vulnerability on 1 or more domains at age 5 (Box 3). Children who had an episode of out-of-home care were almost 1.5 times as likely to have developmental vulnerabilities compared with those who had a notification only (Pilkington et al. 2019).
Data limitations and development opportunities
National integrated datasets can give insight on the risk and protective factors that influence a child’s readiness and transition to school, and how these may vary for more vulnerable groups.
The Australian Institute of Health and Welfare (AIHW) has worked with states and territories to link child protection and AEDC data from selected jurisdictions. If regularly updated, this could facilitate routine reporting on the developmental outcomes of children in contact with child protection. Monitoring how this measure changes could inform planning, policy and services related to child protection.
Where do I find more information?
For information on:
- AEDC results for Indigenous children, see: Indigenous children
- AEDC results, see: Transition to primary school in Children’s Headline Indicators and AEDC Data Explorer
- AEDC research projects in progress, see: The AEDC website
For information on some state-based projects using AEDC data, see Box 3.
Box 3: State-based linkage projects using AEDC data
Several states are linking data from the AEDC to government administrative data to facilitate research into the pathways leading to early developmental vulnerability as measured by the AEDC.
A number of risk factors associated with early developmental vulnerability have been identified including: parental mental illness and criminal offending, perinatal characteristics including parental smoking and occupation, child chronic illness and obesity, hospital admission for infection, exposure to disease, maltreatment and child protection involvement, gestational age, and maternal age.
For more information on state-based projects, see:
New South Wales Childhood Development Study
South Australian Early Childhood Data Project
Western Australian Telethon Kids Institute’s Developmental Pathways Project.
See also Methods.