Breastfeeding and nutrition
Good nutrition is essential for healthy growth and development across the life span–birth to childhood to adulthood. Australia has national guidelines that aim to support optimal nutrition and health for all Australians.
This section provides data relevant to 4 guidelines:
- breastfeeding
- fruit intake
- vegetable intake
- sweetened drinks intake.
Breastfeeding
Key findings
- In 2017–18, around 6 in 10 (61%) children aged 4–47 months had been exclusively breastfed to at least 4 months of age.
- Nearly two-thirds (64%) of infants in 2-parent families were exclusively breastfed to at least 4 months of age, compared with less than half of infants (46%) in 1-parent families.
- Around 7 in 10 (70%) of infants living in the highest socioeconomic areas were exclusively breastfed to at least 4 months of age, compared with around 5 in 10 (53%) infants in the lowest areas.
Breastfeeding promotes the healthy growth and development of infants and young children. In Australia, the National Health and Medical Research Council (NHMRC) publishes infant feeding guidelines recommending that infants be exclusively breastfed (Box 1) until around 6 months of age when solid foods are introduced. The guidelines also recommend that breastfeeding be continued until 12 months of age and beyond, ‘for as long as the mother and child desire’ (NHMRC 2012).
Breast milk contains all the requirements necessary for a baby’s development for the first 6 months and remains the most important part of the baby’s diet, with the addition of appropriate solid foods, until around 12 months. Breast milk continues to provide a valuable source of nutrition and immunological protection for 2 years and beyond (ABA 2013).
Box 1: What is exclusive breastfeeding?
Exclusive breastfeeding means the infant receives only breast milk (including expressed milk) and medicines (including oral rehydration solutions, vitamins and minerals), but no infant formula or non-human milk (WHO 2008).
One measurement difficulty in collecting breastfeeding information relates to the World Health Organization (WHO) (2003) recommendation of exclusive breastfeeding to around 6 months of age. Reporting exclusive breastfeeding to this age is not a stable indicator as solid foods are often introduced at this time. As such, exclusive breastfeeding to around 4 months of age is commonly reported in Australia.
Exclusive breastfeeding is recommended as evidence suggests it has health, nutritional and developmental benefits for infants, including:
- reduced risk of sudden infant death
- reduced risk of necrotising enterocolitis (a condition with high risk of fatality)
- protection against infectious diseases, including gastrointestinal illness, respiratory tract infections and middle ear infections
- protection against overweight and obesity
- reduced risk of type 1 and type 2 diabetes
- reduction in malocclusion (misalignment) in baby teeth
- improved cognitive development (Victora et al. 2016).
Breastfeeding also has health and reproductive benefits for the mother, including reduced risk of breast and ovarian cancer (Victora et al. 2016).
Nutrition as children grow
Key findings
- In 2017–18, around 7 in 10 (72%) children aged 5–14 met the recommended guidelines for fruit consumption.
- Only 1 in 25 children (4.4%) met the recommended guidelines for vegetable consumption.
- Almost half (45%) of children aged 5–14 usually consumed sugar sweetened drinks or diet drinks at least once a week.
As children are constantly growing, good nutrition is key to support their growth and development, and it gives them the energy they need to concentrate, learn and play (NHMRC 2013). A healthy diet also:
- supports children’s physical and cognitive development
- helps to prevent overweight and obesity
- helps to maintain a healthy weight
- increases quality of life
- protects against infection (AIHW 2018).
A balanced and varied diet in childhood also protects against the development of chronic disease and premature death in adulthood (WHO 2018).
Both the quality and quantity of children’s food consumption are important as insufficient or excess amounts of particular foods and nutrients can contribute to ill health.
The NHMRC’s dietary guidelines recommend children eat a wide variety of nutritious foods every day, with a focus on vegetables, fruit, wholegrains, lean meats, fish, legumes and dairy (NHMRC 2013) (Box 3). The guidelines also recommend children reduce their added sugar intake, as increased sugar consumption is associated with excess weight gain and increased risk of dental decay (see Dental health) (NHMRC 2013).
A number of economic, social, cultural, environmental and familial factors, as well as individual preferences, influence the type of diet a child consumes and the likelihood they will receive all the nutrients required for healthy development. Australian research shows that children living in high-income households and advantaged neighbourhoods are more likely to eat a healthy and balanced diet than those in socioeconomically disadvantaged areas, in large part due to the reduced availability and prohibitive cost of fresh and healthy foods (Friel et al. 2015).
Marketing of unhealthy food and drinks has also been found to impact the dietary patterns of children (Cairns et al. 2013).
Box 2: Data sources on breastfeeding and nutrition
Breastfeeding
Data on breastfeeding come from the 2017–18 ABS National Health Survey.
Where there was a child aged 0–3 in the household selected for the survey who was currently receiving breast milk, an adult in the household was asked if the child had ever had any food or drink other than breast milk, and if so, the age the child first did so.
Where there was a child aged 0–3 in the household who was not currently receiving breast milk, an adult was asked when the child stopped and the age the child first had food or drink other than breast milk.
The response to these questions was used to determine the number of children breastfed exclusively to 4 months of age or older (Box 1).
Data in this snapshot are reported for children aged 4–47 months, with the exception of breastfeeding rates over time, where only children aged 4–24 months are analysed for comparability with 2014–15 data. Data for children aged 4–47 months are not available for 2014–15.
Due to changes in the sequencing of breastfeeding surveys, comparable data are not available before 2014–15.
Nutrition
Data on children’s fruit, vegetable and sweetened drinks intake come from the 2017–18 National Health Survey which collected information on children’s diet through interviews with an adult nominated by the household.
Children are reported as meeting fruit and vegetable consumption guidelines if their usual daily number of serves meets the NHMRC recommendations for their age and sex (Box 3: How many serves of fruit and vegetables should children be eating?). The number of days per week children consume sugar sweetened, and artificially sweetened (diet) drinks is also included.
Data are reported for children aged 5–14 to align with the Children’s Headline Indicators Overweight and obesity indicator. Supplementary data are provided for children aged 2–4.
How many children are exclusively breastfed?
Data from the 2017–18 National Health Survey estimate that just under two-thirds (61%) of children aged 4–47 months were exclusively breastfed to at least 4 months of age (ABS 2019b).
Have rates of breastfeeding changed over time?
Due to changes in the age range of children for whom data was collected, time series data are only available for children aged 4–24 months. The rate of children aged 4–24 months who were exclusively breastfed to 4 months and over remained the same between 2014–15 (58%) and 2017–18 (58%) (ABS 2019b).
Due to differences in the age range of children for whom data was collected in different collections. The 2017–18 data in this section do not match data for children aged 4–47 months presented above (Box 2)
Is breastfeeding the same for everyone?
In 2017–18, of infants aged 4–47 months nearly two-thirds (64%) living in 2-parent families were exclusively breastfed to at least 4 months, compared with less than half of infants (46%) living in 1-parent families (Figure 1).
Around 7 in 10 (70%) infants aged 4–47 months living in the highest socioeconomic areas were exclusively breastfed to 4 months and over, compared with just over half (53%) in the lowest areas.
Rates of exclusive breastfeeding to at least 4 months were similar across other groups, regardless of the mother’s birthplace (Australia or overseas) and remoteness area.
Figure 1: Proportion of infants exclusively breastfed to at least 4 months, by priority population group, 2017–18
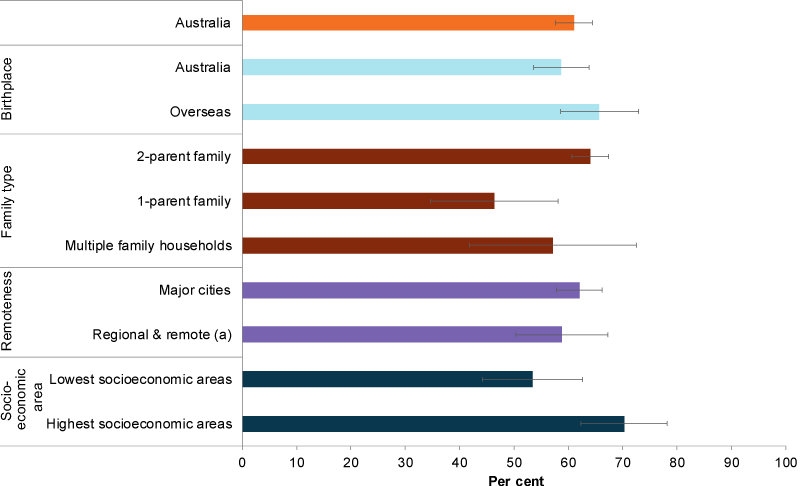
(a) Regional & remote includes Inner regional, Outer regional and Remote areas. Data are presented for children aged 4–47 months who were exclusively breastfed to at least 4 months.
Chart: AIHW. Source: AIHW analysis of ABS 2019b.
How much fruit and vegetables are children eating?
Fruit
Most children ate a sufficient amount of fruit in 2017–18, with around 7 in 10 aged 5–14 (72%) meeting the NHMRC guidelines for fruit consumption (Box 3–NHMRC guidelines). Children were most likely to consume 2 or 3 serves of fruit a day (36% and 24% of those aged 5–14, respectively) (Figure 2).
Figure 2: Proportion of children aged 5–14 consuming fruit and vegetables, by daily number of serves, 2017–18
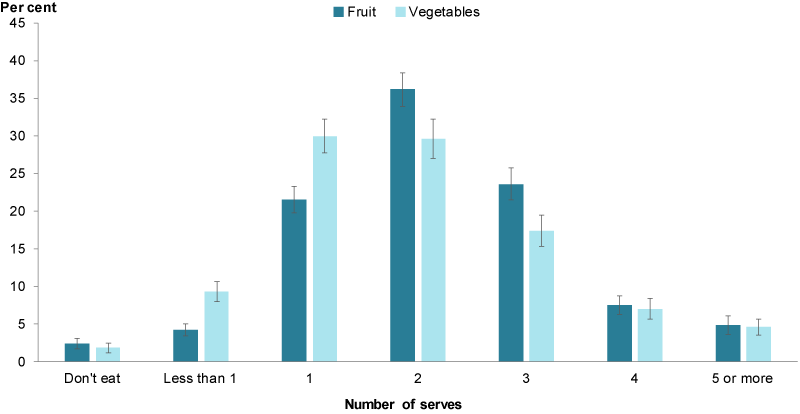
Chart: AIHW. Source: AIHW analysis of ABS 2019a.
In 2017–18, younger children (aged 5–9) were more likely than older children (aged 10–14) to meet the fruit consumption guidelines (78% compared with 66%, respectively). Girls aged 5–14 (75%) were more likely to do so than boys the same age (69%) (Figure 3).
Children aged 2–4 had the highest rate of adequate fruit consumption, with 91% meeting the NHMRC guidelines (ABS 2019a).
Figure 3: Proportion of children aged 5–14 meeting the NHMRC guidelines for fruit consumption, by age group and sex, 2017–18
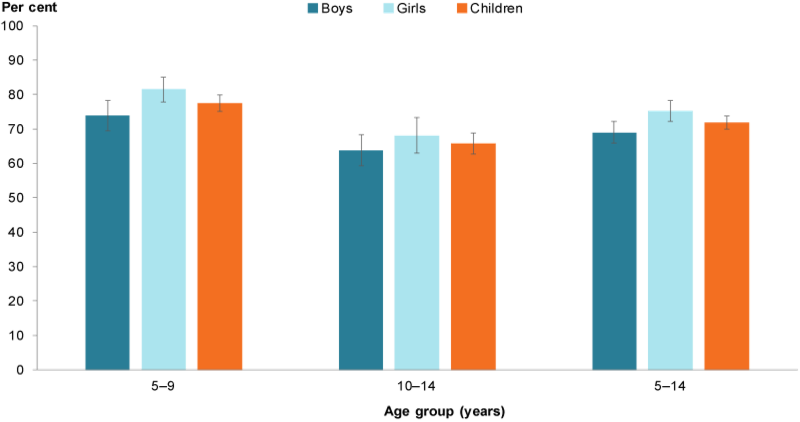
Chart: AIHW. Source: AIHW analysis of ABS 2019a.
Vegetables
In contrast to fruit consumption, the proportion of children aged 5–14 consuming an adequate amount of vegetables in 2017–18 was considerably lower. Only 1 in 25 children (4.4%) met these recommended guidelines (Box 3) (ABS 2019a). Children aged 5–14 were most likely to consume either 1 (30%) or 2 serves (30%) of vegetables a day (Figure 2).
Rates of adequate vegetable consumption were similar across age groups, with 4.7% of children aged 5–9 and 3.8% aged 10–14 meeting the vegetable consumption guidelines. There was little difference between how many boys (3.1%) and girls (5.2%) met the guidelines (ABS 2019a).
Younger children aged 2–4 had slightly higher rates of adequate vegetable consumption, with 13% meeting the guidelines (ABS 2019a).
Box 3: How many serves of fruit and vegetables should children be eating?
The amount of food children need for a diverse, balanced and healthy diet differs by age, sex and level of activity. The NHMRC publishes guidelines on how many serves of fruit and vegetables children need.
In the 2013 guidelines, the minimum recommended number of serves of fruit per day is:
- 1 for children aged 2–3
- 1½ for children aged 4–8
- 2 for people aged 9–18.
The minimum recommended number of serves of vegetables and legumes per day is:
- 2½ for children aged 2–3
- 4½ for children aged 4–8
- 5 for children aged 9–11
- 5 for females aged 12–18
- 5½ for males aged 12–18.
Consumption of sugar sweetened and diet drinks
Based on self-reported data from the 2017–18 ABS NHS, around 6 in 10 (57%) children aged 5–14 did not usually consume sugar sweetened drinks and more than 9 in 10 (93%) did not usually consume diet drinks (ABS 2019a).
Around 4 in 10 children (42%) consumed sugar sweetened drinks at least once a week, while less than 1 in 10 (7.0%) consumed diet drinks at least once a week (ABS 2019a). Almost half (45%) of children aged 5–14 usually consumed sugar sweetened drinks or diet drinks at least once a week (ABS 2019a).
One-third (34%) of children aged 5–14 consumed sugary drinks on 1–3 days a week, and 6.3% did so daily. In comparison, less than 1% of children consumed diet drinks daily and 5.4% on 1–3 days a week (ABS 2019a).
Older children were more likely to drink sugar sweetened beverages, with more than half (53%) of 10–14 year olds consuming these drinks at least once a week compared with one-third (33%) of 5–9 year olds (Figure 4). Similarly, older children were more likely than younger children to consume diet drinks at least once a week (9.7% of 10–14 year olds compared with 4.3% of 5–9 year olds) (ABS 2019a).
Daily consumption of sugar sweetened drinks was also higher in older children (8.1% of 10–14 year olds compared with 4.9% of 5–9 year olds); however daily consumption of diet drinks was low across both age groups (1.1% and 0.8%, respectively) (ABS 2019a).
Boys aged 5–14 were also more likely to consume sugar sweetened drinks than girls of the same age, with 48% of boys and 37% of girls consuming these drinks at least once a week (Figure 4). However, rates of consumption of diet drinks at least once a week was similar among boys and girls (7.7% and 8.8%, respectively) (ABS 2019a).
More than 1 in 5 (22%) children aged 2–4 consumed sugar sweetened drinks at least once a week, and around 3.3% consumed diet drinks at least once a week (ABS 2019a).
Figure 4: Proportion of children consuming sugar sweetened drinks at least once a week, by sex and age group, 2017–18
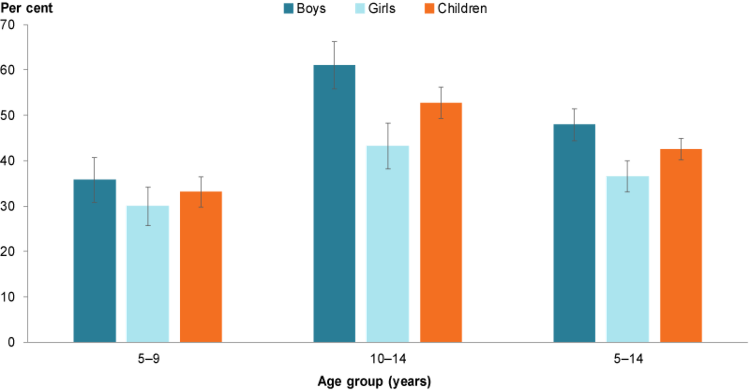
Chart: AIHW. Source: AIHW analysis of ABS 2019a.
Box 4: How much sugar should children be consuming?
The WHO recommends adults and children reduce their consumption of free sugars to less than 10% of total energy intake, and reducing intake to less than 5% of total energy intake would provide additional health benefits (WHO 2015). Five per cent of a child’s total energy intake translates to 2–6 teaspoons of free sugars a day, depending on the age and energy requirements of the child. WHO recommends that intake of artificially sweetened (diet) drinks also be limited, as consumption of both sugar-sweetened and diet drinks increases the risk of dental decay (NHMRC 2013).
Free sugars include all sugars added to food by the manufacturer, cook or consumer, as well as sugars present in honey, syrups, fruit juices and fruit juice concentrates (WHO 2015).
How much sugar is in what we drink?
- fruit juice drink (250ml): more than 27g or 6.5 teaspoons
- small flavoured milk (300ml): more than 28g or 7 teaspoons
- energy drink (600ml): more than 36g or 8.5 teaspoons
- soft drink can (375ml): more than 38g or 9 teaspoons
- soft drink bottle (600ml): more than 64g or 15 teaspoons (DoH 2014).
Has diet improved over time?
The proportion of children aged 5–14 meeting the NHMRC guidelines for fruit consumption was similar between 2014–15 and 2017-18, with around 7 in 10 children meeting the guidelines over the 2 time periods (70% in 2014–15 and 72% in 2017–18) (AIHW analysis of ABS 2015, 2019a).
Although a small number of children consume sufficient serves of vegetables, the proportion meeting the guidelines for vegetable consumption increased between 2014–15 and 2017-18, from 2.9% to 4.4%.
The proportion of children meeting both sets of recommendations also increased slightly from 2.5% to 4.0% over the 2 time periods, driven by the increase in children meeting the vegetable recommendations (Figure 5).
Figure 5: Proportion of children aged 5–14 meeting the 2013 NHMRC guidelines for fruit and vegetable consumption, by year
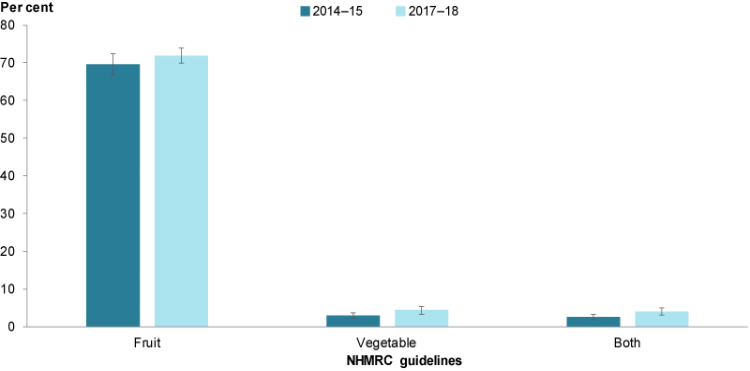
Chart: AIHW. Sources: ABS 2015, 2019a.
Is it the same for everyone?
Fruit
In 2017–18, children living in 2-parent families were more likely to meet the fruit consumption guidelines than children living in families with 1 parent (74% compared with 65%, respectively).
Children with a disability (64%) were less likely than children with no disability (73%) to meet the fruit consumption guidelines.
Children living in areas of greatest socioeconomic disadvantage (63%) were also less likely to meet the fruit consumption guidelines than children living in areas of least disadvantage (74%) (Figure 6).
In 2017–18, there were no differences between population groups in the proportion of children meeting the guidelines for vegetable consumption (ABS 2019a).
Figure 6: Proportion of children aged 5–14 meeting the recommended guidelines for fruit consumption, 2017–18
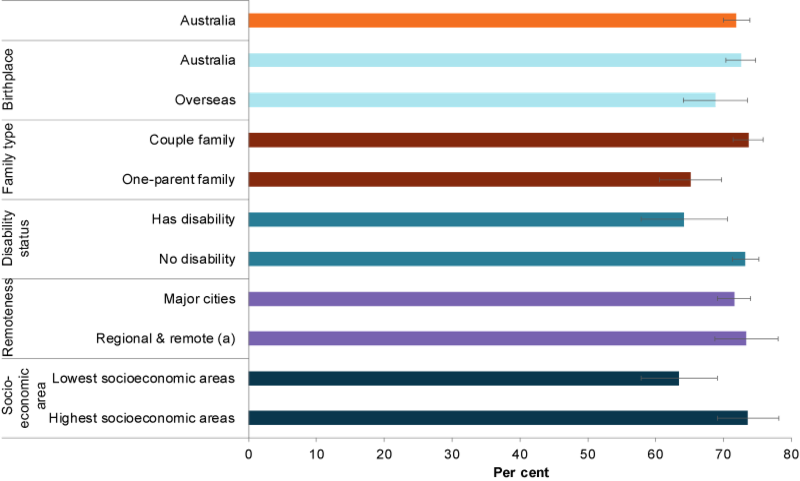
(a) Regional & remote includes Inner regional, Outer regional and Remote areas.
Chart: AIHW. Source: ABS 2019a.
Sugar sweetened drinks
Children living in 2-parent families (40%) were less likely to consume sugar sweetened drinks at least once a week compared with children in 1-parent families (50%). Children born in Australia (42%) were also less likely to consume sugar sweetened drinks at least once a week than children born overseas (49%).
Children living in the lowest socioeconomic areas were considerably more likely to consume sugar sweetened drinks at least once a week than those living in the highest socioeconomic areas (53% and 33%, respectively).
Figure 7: Proportion of children aged 5–14 consuming sugar sweetened drinks at least 1 day a week, by priority population group, 2017–18
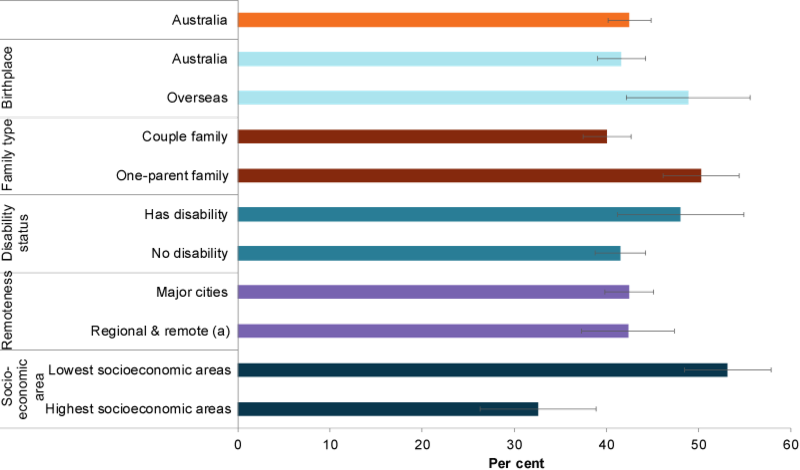
(a) Regional & remote includes Inner regional, Outer regional and Remote areas.
Chart: AIHW. Source: ABS 2019a.
Indigenous children
Data from the National Child Oral Health Study 2012–14 estimates there are differences in the proportion of Indigenous and non-Indigenous children consuming 1 or more sugar-sweetened beverages in a usual day (73% and 50%, respectively) (Do et al. 2016).
Data limitations and development opportunities
Routine national data on breastfeeding are limited. A change in question sequencing prevents the comparison of 2014–15 and 2017–18 data with earlier surveys. In cases where an adult other than the child’s parent responded for the child, accuracy of breastfeeding data may be affected.
To address the absence of routine breastfeeding data, the Australian National Breastfeeding Strategy: 2019 and beyond outlines plans to commission a baseline infant feeding survey and to repeat the survey every 5 years (COAG Health Council 2019).
Changes to the recommended number of serves of fruit and vegetables also prevents the comparison of 2014–15 and 2017–18 data with earlier surveys. As the NHMRC’s 2013 Australian dietary guidelines recommend a higher intake of fruit and vegetables than the preceding 2003 Dietary guidelines for children and adolescents, the proportion of children meeting the guidelines for fruit and vegetable consumption appears considerably lower than estimates from surveys before 2014–15.
Where do I find more information?
For more information on:
- breastfeeding, see: Breastfeeding in Children’s Headline Indicators.
- nutrition in childhood, see: Nutrition across the life stages.