Children with disability
Data updates
25/02/22 – In the Data section, updated data related to children with disability are presented in Data tables: Australia’s children 2022 - Health. The web report text was last updated in December 2019.
Key findings
- In 2015, 7.4% of children aged 0–14 had some level of disability and 4.0% had a severe or profound level of disability.
- Disability was more common among boys (9.4%) than girls (5.4%).
- The most common disability types were intellectual and sensory/speech.
Disability is more than the presence or absence of mental and physical health conditions; it relates to a person’s ability to participate in a range of activities (AIHW 2017a).
Disability may limit what a person can do in their daily life. It is typically measured in terms of the level of difficulty (also expressed as a need for assistance) a person experiences when performing the core activities of daily living: self-care, mobility and communication, as well as difficulties in other activities such as schooling and work.
Schooling is an integral part of life for most children and a child’s disability can be described in terms of core activity limitation and schooling restriction. Schooling restriction is often associated with a need for special assistance or equipment to participate in a mainstream class or attend a special school or special classes (ABS 2013).
Children with disability are an especially vulnerable population. Australian research suggests that children with intellectual disability, and mental and behavioural problems have a greater risk of experiencing maltreatment than children without disability (Maclean et al. 2017).
For more information, see Child abuse and neglect.
Box 1: Data sources on disability
Data on rates of disability for this snapshot are sourced from the ABS 2015 Survey of Disability, Ageing and Carers (SDAC), which collected information about people with disability, older people, and carers who assist people with disability and older people.
How many children have a disability?
It is estimated using data from the 2015 SDAC that, around 7.4% (or 329,000) of Australian children aged 0–14 had some level of disability. The proportion was slightly higher among boys than girls (9.4% compared with 5.4%).
The most common disability types among children were:
- intellectual, reported for an estimated 190,000 children (4.3%)
- sensory/speech, 140,000 children (3.2%) (Figure 1).
Of children aged 5–14, 219,000 (7.6%) had schooling restrictions. This includes children who have core activity limitations and schooling restrictions (ABS 2015).
Figure 1: Children aged 0–14 with disability, by disability group, 2015
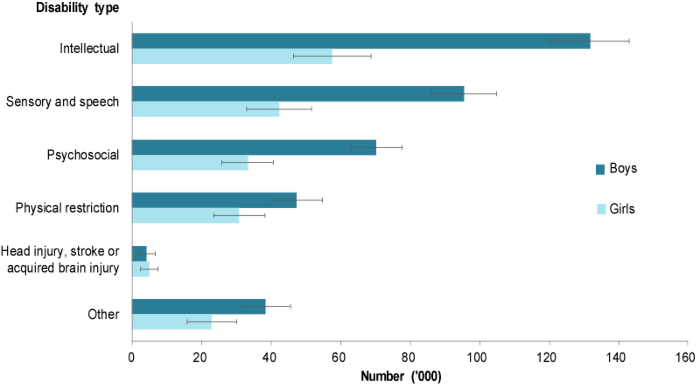
Note: Figure is based on all reported conditions and so children with multiple conditions will be counted more than once.
Chart: AIHW. Source: ABS 2015.
How many children have a severe disability?
Around 177,000 children aged 0–14 (4.0%), had a severe disability in 2015 (Figure 2).
Boys (5.2%) were twice as likely as girls (2.6%) to have a severe disability, and the prevalence of severe disability was higher among children aged 5–9 (5.5%) than among those aged 10–14 (4.4%) or 0–4 (2%) (ABS 2015).
The higher rate among children aged 5–9 may:
- relate to increased identification of activity restrictions upon starting school
- relate to the availability of assistance
- suggest that some issues resolve or become less prominent in the minds of parents, children and/or teachers as children get older
- relate to the complexity of asking and answering questions about activity limitations among children aged 0–4, who, regardless of disability, are likely to need assistance in many activity areas due to their age (AIHW 2004).
Figure 2: Disability status of children aged 0–14, 2015
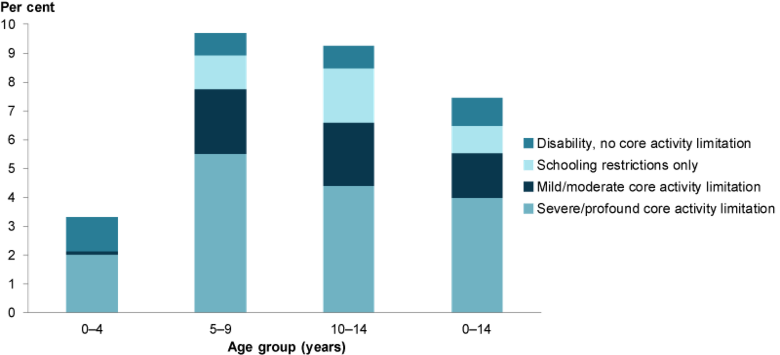
Note: The category ‘schooling restriction’ above does not include children who have a core activity limitation and a schooling restriction.
Chart: AIHW. Source: ABS 2015.
Has the prevalence of disability changed over time?
The prevalence of disability in children has remained stable with the proportion of those aged 0–14 with any type of disability decreasing slightly from 8.3% in 2003 to 7.4% in 2015. Over the same period, the proportion of children with severe disability remained stable at around 4% (Figure 3).
Figure 3: Prevalence of disability in children aged 0–14, 2003–2015
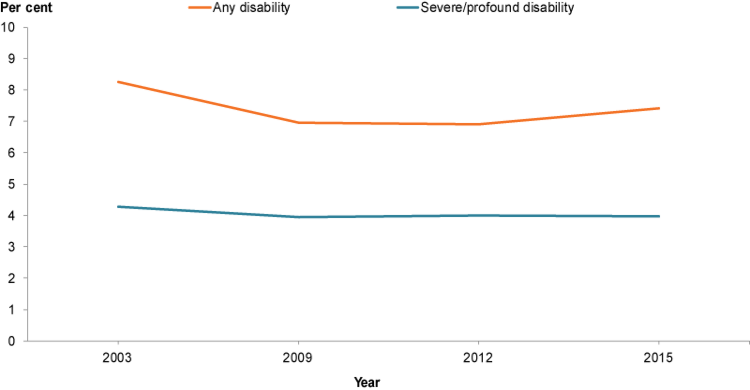
Chart: AIHW. Sources: ABS 2003, 2009, 2012, 2015.
Box 2: 2018 SDAC results
According to the 2018 SDAC, an estimated 7.7% (or around 357,000) children aged 0–14 had some level of disability. These results were similar to those for 2015. Rates of disability varied according to age and sex. The largest difference between males and females was for children aged 5–14 (12% of boys with disability compared with 7.1% of girls) (ABS 2019a).
In 2018, an estimated 4.5% (or around 211,200) children aged 0–14 had a profound or severe disability. Generally, this was more likely among boys than girls—3.3% of boys aged 0–4 had a profound or severe disability compared with 1.5% of girls aged 0–4. Similarly, 7.5% of boys aged 5–14 had a profound or severe disability compared with 3.7% of girls of the same age (ABS 2019a).
Do rates of disability vary across population groups?
In 2015, the proportion of children aged 0–14 with severe disability was highest:
- in Inner regional areas (5.4%) and lowest in Major cities (3.6%)
- among low-income households (5.2%) and lowest among high-income households (3.1%) (ABS 2015) (Figure 4).
The higher representation of children with severe disability among low-income households may be a result of decreased household earnings due to parental caring responsibilities.
Information about the prevalence and type of disability among Indigenous children nationally is limited (ABS 2019b). According to the 2015 Survey of Disability, Ageing and Carers, rates of severe disability were similar among Indigenous and non-Indigenous children aged 0–14 (5.9% and 3.9%, respectively) (ABS 2017).
Figure 4: Proportion of children aged 0–14 with severe disability by priority population group, 2015
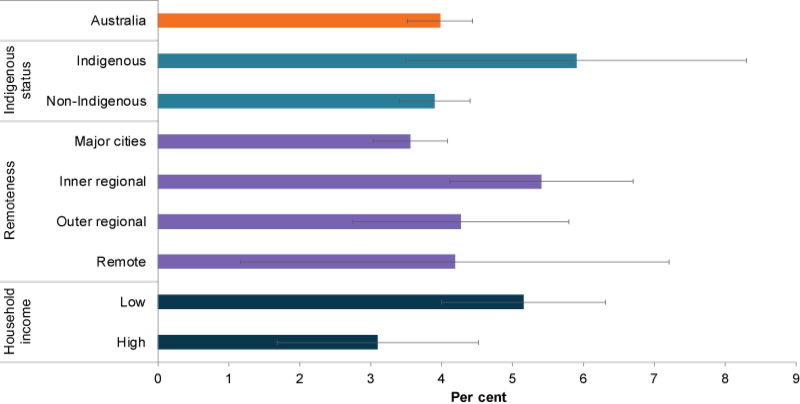
Chart: AIHW. Sources: ABS 2015, 2017.
Data limitations and development opportunities
While the SDAC provides information on the number of children with disability, including disability type, health conditions and some household and family characteristics, disability status is not commonly captured in other routinely collected data sources. This makes it difficult to compare outcomes for children with disability with other children across a wide range of topics.
This report includes data for children with disability in other snapshots, wherever possible.
Where do I find more information?
For more information on:
- children with disability, see: Children with disabilities in Australia and Disability updates: children with disabilities.
- children with disability and education (primary and secondary school-age children), see: Engagement in education and Education participation needs and challenges
- people with disability, including disability-free life expectancy at birth, see: People with disability in Australia, Life expectancy and disability in Australia and Australia’s Welfare 2017
Box 3: Defining and measuring disability
The ABS SDAC defines a person as having a disability if they report having a limitation, restriction or impairment, which has lasted, or is likely to last, for at least 6 months and restricts everyday activities (ABS 2019a).
A person with a very high level of disability will sometimes or always need help with self-care, mobility or communication. The SDAC defines this level of disability as ‘severe or profound core activity limitation’. For ease of reference in this report, this has been shortened to severe disability.
Estimates of the number of children with disability vary across data sources due to differences in the definition of disability and the age groupings used for reporting purposes. For example, the Nationally Consistent Collection of Data on School Students with Disability, which collects information about Australian students who receive a government-funded educational adjustment to address disability, reports that 18.8% of all Australian primary and secondary students received an adjustment in 2017 (Productivity Commission 2019).
Indigenous peoples
The Census of Population and Housing also collects data on disability using 4 questions about a person’s need for assistance with a core activity of self-care, mobility and communication. These questions are based on the measure of ‘severe or profound core activity limitation’ in the SDAC.
The 2016 Census estimated that Indigenous children aged 0–14 were 1.7 times as likely as non-Indigenous children to require assistance, higher than the 2015 SDAC estimates. However, Census estimates of Indigenous disability should be interpreted with caution as a significant number of people do not respond to the ‘need for assistance’ questions, and it is estimated that the Census significantly undercounts Indigenous people (ABS 2019b).