Overweight and obesity
Key findings
- In 2017–18, around 1 in 4 (24%) children aged 5–14 were overweight (17%) or obese (7.7%).
- The proportion of children overweight or obese remained relatively stable between 2007–08 (23%) and 2017–18 (24%).
- Children living in a Regional and Remote area were more likely to be overweight or obese (29%) than children living in Major cities (23%).
Overweight and obesity (the abnormal or excessive accumulation of fat in the body), increases a child’s risk of poor physical health and is a risk factor for illness and mortality in adulthood. Overweight and obesity generally results from a sustained energy imbalance, where the amount of energy a child consumes through eating and drinking outweighs the energy they expend through physical activity and bodily functions (AIHW 2017).
Behaviours influencing the likelihood of this imbalance include:
- increased consumption of energy-dense, low-nutrient foods and sugar-sweetened beverages
- insufficient physical activity
- increased sedentary activity
- increased time spent in front of screens
- insufficient sleep (CDC 2016).
A complex interaction of biological, environmental and social factors also influences the likelihood of a child gaining excess weight, including:
- genetic differences in appetite and metabolism
- accessibility of fresh and healthy food,
- fewer options for safe outdoor play (NHMRC 2013; WHO 2014).
Children with obesity have a higher risk of experiencing breathing difficulties, bone fractures, hypertension, insulin resistance and early markers of cardiovascular disease (WHO 2018).
Children with overweight and obesity are also more likely to become obese adults, and to develop chronic conditions such as type 2 diabetes and cardiovascular disease at younger ages (Sahoo et al. 2015). Childhood obesity is also associated with an increased incidence of diabetes, coronary heart disease and some cancers in adulthood (Llewellyn et al. 2016).
In addition to physical health problems, children with overweight and obesity can often experience weight-based teasing and bullying which can have an impact on their:
- psychological wellbeing
- peer relationships
- school experiences
- self-confidence in being physically active (Pont et al. 2017).
Australian research also suggests that overweight and obesity in childhood is associated with depression, poorer health-related quality of life, and low self-esteem (Sanders et al. 2015).
Box 1: Defining and measuring overweight and obesity
Body mass index (BMI) is used to measure overweight and obesity in children. It is calculated as the ratio of weight in kilograms divided by height in metres squared (kg/m2).
As children are constantly growing, BMI changes substantially with age and can differ between boys and girls. At population level, international cut-off points are used to determine the number of children either underweight, normal weight, overweight or obese based on their age and sex (Cole et al. 2000).
Box 2: Data sources on overweight and obesity in children
Data from the ABS 2017–18 National Health Survey are reported here. This survey collected physical measurements of the height and weight of children, excluding those living in Very remote areas.
The most recent data on the prevalence of overweight and obesity among Indigenous children comes from the ABS 2012–13 Australian Aboriginal and Torres Strait Islander Health Survey. To compare rates of overweight and obesity between Indigenous and non-Indigenous children, data for non-Indigenous children are taken from the ABS 2011–12 Australian Health Survey.
How many children are overweight or obese?
In 2017–18, while most children aged 5–14 (67% or just over 2 million) were a normal weight, an estimated 24% (746,000) of children were overweight (17%) or obese (7.7%) (Figure 1).
For children aged 5–9 and 10–14, similar proportions of boys and girls were overweight and obese (ABS 2019a).
Figure 1: Body mass index of children aged 5–14, by body mass index category, 2017–18
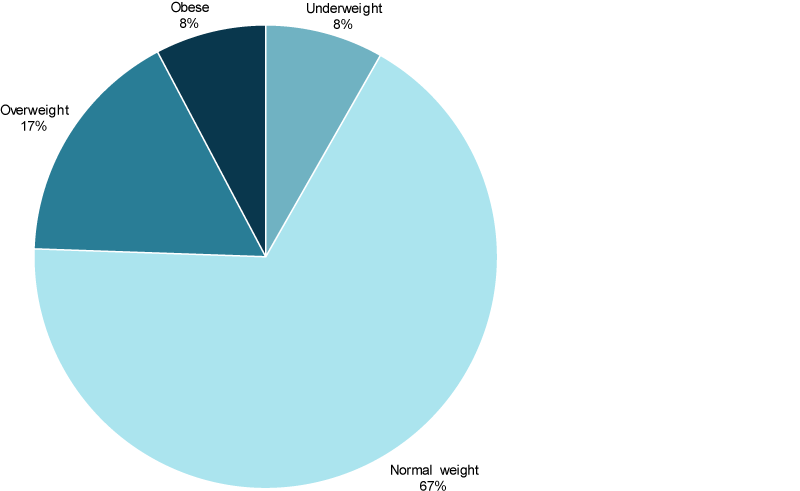
Source: ABS 2019a.
Have rates of overweight and obesity in children improved over time?
Over the 10 years before 2008, Australian research suggests that the prevalence of overweight and obesity in children plateaued, or only increased slightly, estimated at around 21%–25% (Garnett et al. 2011; Olds et al. 2010).
Data from the ABS National/Australian Health Survey series indicate no real change in the prevalence of overweight and obesity among children aged 5–14 between 2007–08 and 2017–18. Estimates of prevalence rose slightly from 23% to 26% between 2007–08 and 2014–15, before falling slightly to 24% in 2017–18; however these changes were not statistically significant (Figure 2).
Figure 2: Overweight or obese children aged 5–14, 2007–08 to 2017–18
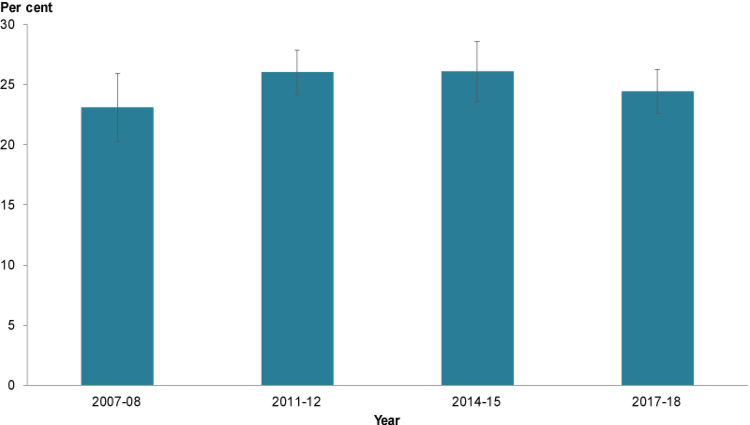
Chart: AIHW. Source: ABS 2019a; AIHW 2018.
Is the prevalence of overweight and obesity the same for everyone?
In 2017–18, more children aged 5–14 were overweight or obese:
- in Regional and remote areas (29%) than in Major cities (23%). Data were not collected for children living in Very remote areas.
- in 1-parent families (29%) than children living in 2-parent families (23%)
- if they had disability (30%) than those with no disability (24%) to be overweight or obese (Figure 3).
The prevalence of overweight and obesity among children aged 5–14 was similar between those living in the lowest socioeconomic areas (27%) and those in the highest areas (22%). This may be due to the small sample size for these groups in the National Health Survey, as research suggests that children in disadvantaged families are typically at a higher risk of overweight and obesity than children from less disadvantaged families (Jansen et al. 2013).
Figure 3: Proportion (%) of children aged 5–14 who were overweight or obese, by priority population groups, 2017–18
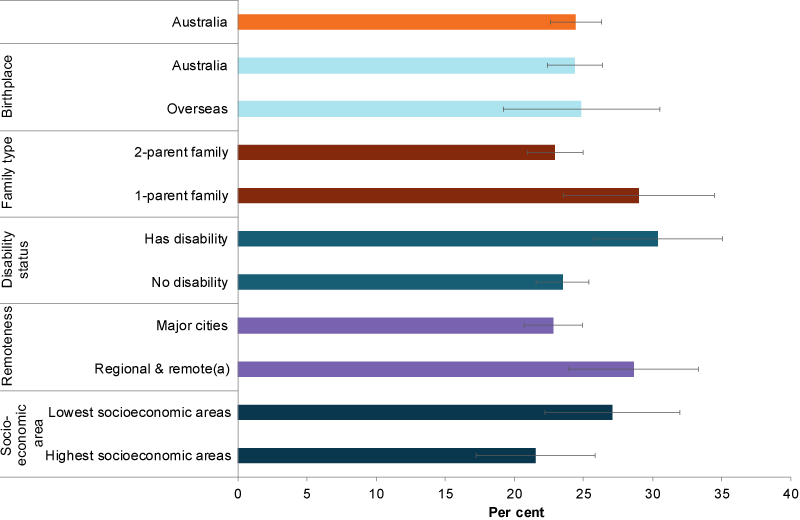
Note: (a) Regional & remote includes Inner regional, Outer regional and Remote areas. Very remote areas were excluded from the survey.
Chart: AIHW. Source: ABS 2019a.
Data from the 2012–13 ABS Australian Aboriginal and Torres Strait Islander Health Survey and 2011–12 Australian Health Survey shows differences in the proportion of Indigenous and non-Indigenous children aged 2–14 who were underweight (8.4% compared with 4.8%), as well as overweight or obese (30% compared with 25%). The difference in overweight and obesity was mainly due to higher obesity rates (10% compared with 6.5%), and higher rates of both overweight and obesity in Indigenous children aged 10–14 (37% compared with 27%) (Figure 4).
However, rates of overweight and obesity among Indigenous children varied by remoteness, with those aged 2–14 in Very remote areas being less likely to be overweight or obese (22%) than those in Major cities (36%). This pattern was consistent with other research that found lower rates of overweight and obesity among Indigenous children in remote areas compared to urban areas (Dyer et al. 2017).
Figure 4: Overweight and obese children aged 2–14, by Indigenous status and age group, 2011–12 and 2012–13
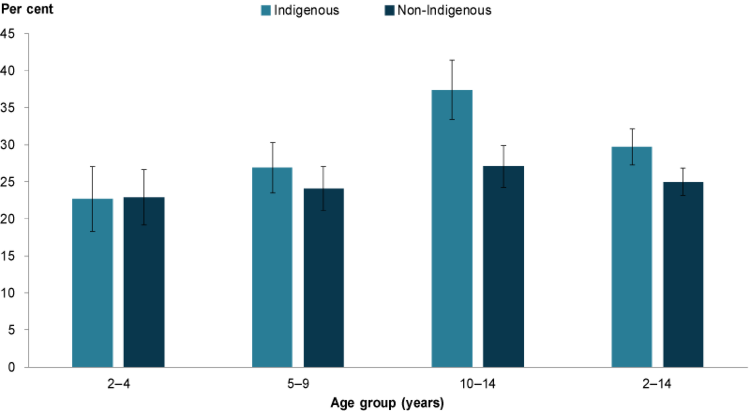
Note: Data for Indigenous children was collected in 2012–13. Data for non-Indigenous children was collected in 2011–12.
Chart: AIHW: Source: ABS 2014.
Data limitations and development opportunities
While the ABS National Health Surveys provide estimates of the prevalence of overweight and obesity, participants can choose to opt-out of having their height and weight measured, which may affect the accuracy of these population estimates.
In 2017–18, 44% of respondents aged 2–17 years did not have their height, weight or both measured. For these respondents, imputation was used to obtain height, weight and BMI scores (ABS 2019b). The National Health Survey may also under-represent some groups as it does not cover Very remote areas or non-private dwellings such as hotels, motels, hostels, hospitals, and short-stay caravan parks.
Where do I find more information?
For more information on factors contributing to overweight and obesity in Australia’s children, see:
For information on:
- overweight and obesity in children, see: Overweight & Obesity in Children’s Headline Indicators and Overweight and obesity: an interactive insight 2019 .