Teenage mothers
Data updates
25/02/22 – In the Data section, updated data related to teenage mothers are presented in Data tables: Australia’s children 2022 - Health. The web report text was last updated in December 2019.
Key findings
- In 2017, births to teenage mothers made up 2.2% of all live births.
- Births to teenage mothers decreased by more than 40% between 2006 and 2017 from 17.6 to 9.2 live births per 1,000 females aged 15–19.
Motherhood for women under the age of 20 can be a positive and maturing experience. For many young people, becoming a parent can have a transformative impact, particularly with changing unhealthy behaviours and relationships (AHRC 2017; Rhys Price-Robertson 2010).
Recent findings also show some positive birth outcomes for teenage mothers compared with mothers aged 20–24 with teenage mothers:
- more likely to have a spontaneous labour (and less likely to have a caesarean section)
- less likely to have diabetes
- less likely to have gestational diabetes (AIHW 2018).
However, mothers who give birth under the age of 20 are also a vulnerable population group, who may experience lower education and reduced employment. This may increase the risk of socioeconomic disadvantage for both child and mother (Marino et al. 2016). Children of vulnerable young parents are also at risk of becoming teenage parents themselves (Gaudie et al. 2010; Marino et al. 2016).
Teenage motherhood is associated with a number of poorer health and wellbeing outcomes for both mother and baby. In the short-term, babies born to teenage mothers are at greater risk of being born pre-term, with a low birthweight, stillbirth and neonatal death (AIHW 2018; Marino et al. 2016). Children of teenage mothers may go on to have behavioural, emotional and cognitive disadvantages (Marino et al. 2016). Depression is more prevalent among pregnant teenagers than adult pregnant women or teenagers in general, and teenage motherhood can have a long-lasting effect on mental health (Marino et al. 2016).
Box 1: Data source on teenage mothers
Data on teenage mothers is sourced from the National Perinatal Data Collection (NPDC). The NPDC is a national population-based cross-sectional collection of data on pregnancy and childbirth. The data are based on births reported to the perinatal data collection in each state and territory. Rates are calculated using denominators based on the ABS estimated resident population of females aged 15–19.
How many children are born to teenage mothers?
In 2017, around 6,600 babies were live-born to teenage mothers—a rate of 9.2 live births per 1,000 females aged 15–19. Births to teenage mothers made up 2.2% of all live births.
Have birth rates to teenage mothers changed over time?
Births to teenage mothers decreased by more than 40% between 2006 and 2017 from 17.6 to 9.2 per 1,000 females aged 15–19 (Figure 1).
Figure 1: Births to teenage mothers, 2006–2017
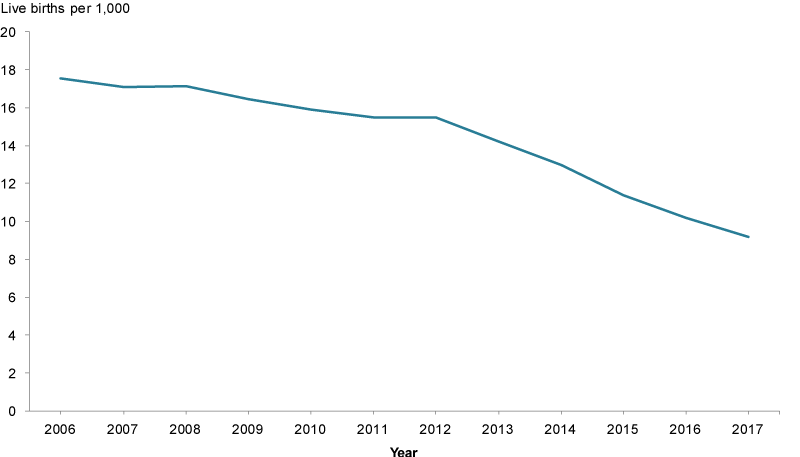
Chart: AIHW. Source: AIHW NPDC.
In Australia, this decrease has been attributed to greater personal control over fertility rather than an increase in terminations (Marino et al. 2016).
In the 10 years to 2015, there was also been a change in the age distribution of teenage mothers. The proportion of mothers aged 16 decreased from 8.7% to 6.9% while the proportion of mothers aged 19 increased from 42% to 46% (AIHW 2018).
Are teenage births rates the same for everyone?
Teenage birth rates differ across population groups (Figure 2). In 2017, teenage mothers aged 15–19 were more likely to:
- live in Remote and very remote areas (21 births per 1,000) than in Major cities (3.2 births per 1,000)
- live in areas of greater socioeconomic disadvantage (21 births per 1,000compared with 1.7 births per 1,000 in areas of least disadvantage).
- be born in Australia (9.9 births per 1,000) than overseas (5.6 births per 1,000).
Differences were also evident between Indigenous teenage mothers (46.4 births per 1,000) and non-Indigenous women (7.1 per 1,000). However, Indigenous teenage birth rates decreased considerably from 70 births per 1,000 Indigenous women aged 15–19 in 2006, to 46 births per 1,000 in 2017. See also Indigenous children.
Note that not all these categories are mutually exclusive. It is likely that some of these associated factors overlap.
Figure 2: Births to teenage mothers by selected population groups, 2016
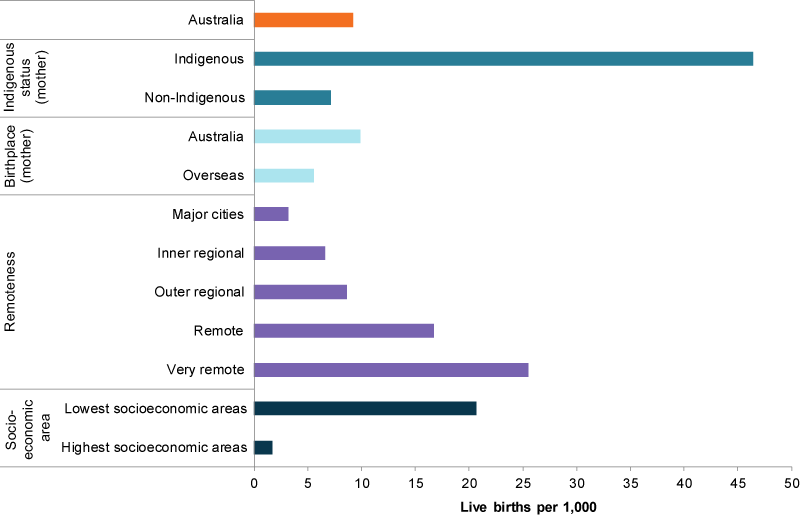
Chart: AIHW. Source: AIHW NPDC.
How does Australia compare internationally?
Internationally, Australia’s birth rate for mothers aged 15–19 was lower than the national Organisation for Economic Co-operation and Development (OECD) average, according to the most recent OECD report on births to teenage mothers (Figure 3). Australia’s birth rate for these mothers (11.9 births per 1,000) was lower than the OECD average of 36 countries (12.4 births per 1,000). Korea had the lowest teenage birth rate (1.3 births per 1,000) while Mexico had the highest (66 per 1,000) (OECD 2018).
Figure 3: Births to teenage mothers by selected OECD countries and rankings, 2016
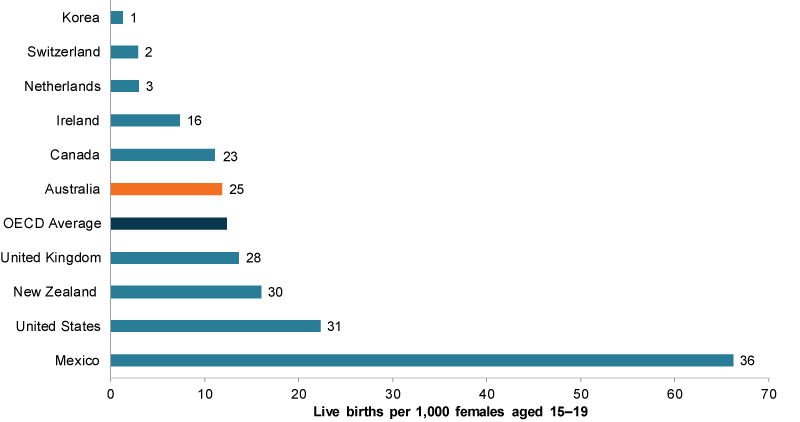
Notes:
- Data for Canada refer to 2013, for Australia and the United States to 2015.
- Data in this graph are for OECD member states only.
- Graph reflects top 3 countries, English-speaking background countries, and bottom-ranked country.
Chart: AIHW. Source: OECD Family Database.
Data limitations and development opportunities
The teenage birth rate includes only live births to teenage mothers, and is therefore lower than the pregnancy rate, which would include stillbirths, miscarriages and terminations.
National data are not currently available on termination, with South Australia and Western Australia the only states to have data publicly available. Pregnancy termination rates in these states have declined since the late 1990s (Hutchinson & Ballestas 2018, SA Health 2018). In South Australia, the rate decreased from 23.6 to 8.3 per 1,000 women aged 15–19 between 2001 and 2016, respectively. While in Western Australia, the rate decreased from 23.1 to 9.1 for the same age group between 2002 and 2015, respectively.
Where do I find more information?
For more information on:
- teenage mothers for Indigenous children, see: Indigenous children
- births to teenage mothers, see: Teenage births in Children’s Headline Indicators.
- selected indicators disaggregated by maternal age, including teenage mothers, see: National Core Maternity Indicators data visualisations, Demographics of mothers and babies: Maternal age in Australia’s mothers and babies data visualisations and Australia’s mothers and babies 2017—in brief.
- teenage motherhood, see: Teenage mothers in Australia 2015 and Australia’s mothers and babies 2017—in brief.