Material deprivation
Key findings
- In 2014, around 1 in 6 (16%) children aged 0–14 lived in households deprived of at least 2 essential items—this increased to more than 1 in 3 (35%) for 1-parent households.
- Children in jobless families were especially vulnerable—almost half (48%) were deprived of 2 or more essential items.
- Around 1 in 6 (17%) children lived in households that did not have $500 in savings for an emergency and 1 in 16 (6%) lived in households that could not afford dental treatment when needed.
Economic disadvantage can be made up of multiple factors, including low income, material deprivation and social exclusion (PC 2018). While low income can be used to assess the level of resources available to a household, material deprivation illustrates the balance between resources available and living standards achieved with those resources (Wilkins 2016).
Material deprivation exists when people do not have, and cannot afford, items or activities widely regarded as essential for participating fully in a society (Box 1). Material deprivation can be a valuable measure of disadvantage among children, especially as resources are not always shared equitably within households (Saunders et al. 2018). Measures of material deprivation can be also adapted to reflect children’s perspectives of what is essential for an acceptable standard of living (Box 2).
This section complements Family economic situation by focusing on material deprivation as a form of economic disadvantage among children in Australia. Data from the Household, Income and Labour Dynamics in Australia (HILDA) survey are available to report on material deprivation among households with children aged 0–14; however these data are recorded at household level and reflect the priorities of adult respondents (Box 1).
Box 1: Data sources and definitions
Data sources
Data on material deprivation are from the HILDA survey. HILDA is a longitudinal household study that collects information about economic and personal wellbeing. Data on material deprivation are collected at household level, with selected items asked only of households with school-aged children. The module is completed by an adult living in the household, and is repeated every 4 years, with the latest data available from 2014.
How is material deprivation measured?
The material deprivation module in HILDA is derived from previous studies conducted by the Social Policy Research Centre on material deprivation among adults (Saunders et al. 2007; Saunders & Wong 2012). The module asks a respondent from each household to specify if they consider these items essential, whether they have an item, or if they do not, if it is because they cannot afford it:
- getting together with friends or relatives for a drink or meal at least once a month
- medical treatment when needed
- furniture in reasonable condition
- decent and secure home
- medicines when prescribed by a doctor
- warm clothes and bedding, if it is cold
- television
- substantial meal at least once a day
- week’s holiday away from home each year
- roof and gutters that do not leak
- telephone (landline or mobile)
- home contents insurance
- washing machine
- motor vehicle
- access to internet at home
- comprehensive motor vehicle insurance
- at least $500 in savings for an emergency
- home with doors and windows that are secure
- dental treatment when needed
- buying presents for immediate family or close friends at least once a year
- when cold, able to keep at least 1 room of the house adequately warm
- separate bed for each child
- yearly dental check-up for each child
- hobby or regular leisure activity for children
- new school clothes for school-age children every year
- children being able to participate in school trips and school events that cost money.
Of the 26 items presented in the module, 22 were considered essential by most respondents. The items not considered essential by most respondents were:
- a television
- a week’s holiday away from home once a year
- access to the internet at home
- buying presents for immediate family or close friends at least once a year (Wilkins 2016).
This approach is often referred to as the consensual approach as it relies on a common understanding of what constitutes an acceptable standard of living. A person’s individual level of deprivation can be determined by the number of essential items their household does not have and cannot afford. Deprivation levels can be used to calculate the average number of items people are deprived of across a group, also referred to as the ‘mean deprivation score’.
This section uses a 2-item measure of deprivation to allow for response errors. A person is considered living with material deprivation if they do not have, and cannot afford, at least 2 essential items.
How many children live with material deprivation?
In 2014:
- 1 in 6 (16%) children aged 0–14 lived in households deprived of 2 or more essential items
- 1 in 10 (10%) in households deprived of 3 or more items.
On average, children aged 0–14 lived in households with higher levels of deprivation than people aged 15 years and over. The mean deprivation score for children aged 0–14 was 0.7 items compared with 0.4 for those aged 15 years and over.
These findings are based on shared household items, and adult perceptions of what is considered essential.
For more information on how material deprivation measures can be adapted for children, see Box 2.
Box 2: Material deprivation from a child’s perspective
Many recent studies have adopted a deprivation approach to better understand children’s experiences of disadvantage. Saunders et al. (2018) reported on material deprivation among high school students in years 7–10 in New South Wales, using the consensual approach to identify items that young people consider essential.
The study developed a Child Deprivation Index to compare the circumstances of different groups and highlight factors associated with higher levels of deprivation (Saunders et al. 2018).
In a similar study, Redmond et al. (2016) identified the items essential to children in years 4–6 and reported levels of material deprivation based on those items. The items were assumed to reflect a child’s socioeconomic background and included:
- an iPod or other personal music player
- right clothes to fit in
- money to spend
- a mobile phone
- money for school camp.
The most common deprivations experienced were not having:
- a mobile phone
- money to save each month
- an iPod or other music player.
More than one-quarter (26%) of year 4 and 6 students were deprived of 2 or more items; however deprivation differed considerably according to age with 65% of Year 8 students having no deprivations.
The study reiterated the importance of including children’s perspectives to better understand their needs, priorities and experiences of deprivation.
How is material deprivation commonly experienced?
In 2014, according to HILDA, the most common items households with children did not have, and could not afford, were at least $500 in savings for an emergency, home contents insurance, and dental treatment when needed.
- around 1 in 6 (17%) children lived in households that did not have $500 in savings for an emergency
- 1 in 9 (11%) in households that could not afford home contents insurance
- 1 in 16 (6%) in households that could not afford dental treatment when needed (Figure 1).
Figure 1: Proportion of children aged 0–14 deprived of select essential items, 2014
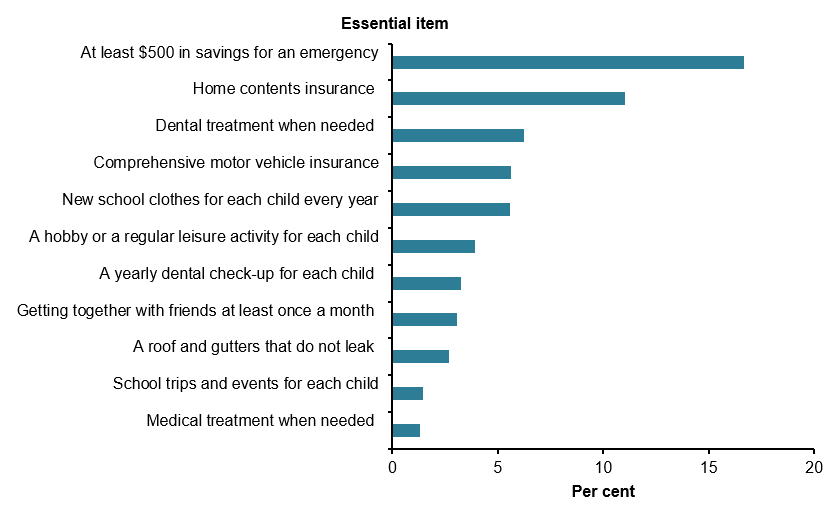
Note: Questions about motor vehicle insurance were only asked to households with a motor vehicle.
Chart: AIHW. AIHW analysis of HILDA.
The material deprivation module also asked households if they could afford certain items for each school-aged child in the household. The data showed that:
- 5.6% of households did not have, and could not afford, new school clothes for each child every year
- 3.9% of households did not have, and could not afford, a hobby or regular leisure activity for each child
- 3.3% of households that did not have, and could not afford, yearly dental check-ups for each child.
How does material deprivation differ between groups?
In 2014, children in 1-parent households were more likely to experience material deprivation compared with children living in couple-family households.
More than one-third (35%) of children in 1-parent households were deprived of 2 or more items, compared with 12% in couple-family households. Similarly, one-quarter (25%) of children living in 1-parent households experienced deprivation of 3 or more items, compared with 6.8% in couple-family households.
Levels of material deprivation increased with remoteness. The proportion of children living in households deprived of 2 or more items was higher in Outer regional areas (26%) than in Inner regional areas (20%) or Major cities (14%). However, limited data are limited on the experiences of deprivation among children in Remote or Very Remote areas.
Levels of household income, sources of income and other related factors such as parental employment are key determinants of material deprivation among children. Half (50%) of all children living in households where government payments were the primary source of income were deprived of 2 or more essential items. This is 4 times as high as deprivation among children in households where the primary source of income was wages or salaries (9.5%).
Government payments include:
- income support payments, such as pensions, allowance and government payments
- non-income support payments, such as family payments and mobility and carer allowances.
Almost half (48%) of children living in jobless households were deprived of 2 or more essential items. Jobless households are those with children under the age of 15 that have no paid employment.
The proportion of children in jobless households experiencing material deprivation of 2 or more items is substantially higher (48%) than households where at least 1 person was in paid employment (12%). Children in jobless households (35%) were also more likely deprived of 3 or more items compared with children in households with paid employment (6.9%).
Data limitations and development opportunities
There are limitations in measuring an individual’s level of deprivation by counting the number of items they cannot afford. This approach gives equal weight to different goods, services and activities and does not account for the seriousness of different forms of deprivation. The impact of not being able to afford getting together with friends or relatives for a drink or meal at least once a month may differ substantially from being deprived of getting medical treatment when needed (McLachlan et al. 2013). More work is therefore required to determine how the items outlined in Box 2 should be viewed relative to each other. An alternative is to place greater weight on deprivation of items considered essential by larger proportions of the population (Saunders et al. 2019).
There is limited scope to analyse material deprivation over time. Because material deprivation is relative to society’s perception of what is essential at a given point, it is subject to change. While some items, such as medical treatment, a substantial meal, or warm clothes, may continue to be seen as essential, the number and composition of items considered essential are likely to evolve as preferences change (McLachlan et al. 2013).