Neighbourhood safety
Key findings
- Data from the Longitudinal Study of Australian Children (LSAC) in 2015–16 estimated that 91% of children aged 12–13 felt safe in their neighbourhood.
- 9 out of 10 adults aged 18 and over living in households with at least 1 child aged 0–14 who were home alone during the night, felt safe/very safe.
- The PIRLS 2016 found that more Australian teachers judged their schools to be very safe and orderly than the international average (78% compared with 62%).
Healthy neighbourhoods generally involve quality housing, services, green spaces, and strong social connections. High neighbourhood quality is associated with a wide range of positive child outcomes, including positive physical and mental health, higher educational attainment, and lower rates of child maltreatment and youth justice involvement (Dupere et al. 2010; Edwards & Bromfield 2010; Mingh et al. 2017; Webb et al. 2017; White & Cunneen 2015).
One commonly used indicator of neighbourhood quality is neighbourhood safety, with measures of perceived safety and victimisation regularly used (Berglund et al. 2017; Ferguson 2006) (Box 1).
Box 1: Defining neighbourhood safety
Neighbourhood safety is a broad term comprising many physical and non-physical aspects. It includes, but is not necessarily limited to:
- neighbourhood crime rate
- safety of public places and schools
- safety of infrastructure and open spaces (for example, public transport, roads, parks),
- quality safe relationships within the local area (for example, neighbours that you can trust)
- levels of social unrest (Berglund et al. 2017; Goldfeld et al. 2017; Queensland Child and Family Commission 2018).
Perceived neighbourhood safety is often measured by surveying how safe and/or vulnerable people feel during different times of the day under varying circumstances, for example home alone at night (Ferguson 2006).
Both household experiences with crime and parental perception of neighbourhood safety have been found to impact a child’s daily life by shaping the activities parents allow children to be involved in outside the home (Glaster & Santiago 2006; Goldfeld et al. 2017; Molnar et al. 2004). For example, negatively perceived neighbourhood safety is associated with increased sedentary behaviour among adolescents and increased risk of poor future health outcomes such as cardiovascular disease and obesity (Lenhart et al. 2017). Children’s personal perceptions of safety and their behaviour can also be influenced by neighbourhood safety, a sentiment explored in This place I call home: the views of children and young people growing up in Queensland (Goldfeld et al. 2017; Queensland Child and Family Commission 2018).
Data on children’s perspectives of safety in their environment are presented in this section. Self-reported perceptions of neighbourhood safety are also reported; specifically, the perception of adults who live in households with children aged 0–14, and the perception of Year 4 teachers on the safety of their school and its neighbourhood (Box 2).
Children’s perspectives of bullying are discussed in Bullying.
Box 2: Measuring perceived neighbourhood safety
The LSAC measures perceived safety in a number of ways, including directly asking children if they feel safe in their neighbourhood. Data included are for children aged 10–11 in 2009–10, and aged 12–13 in either 2011–12 or 2015–16.
The ABS General Social Survey (GSS) measures perceived neighbourhood safety by asking respondents how safe they felt alone at home during the night and walking in the local area during the night on their own. In previous years, the GSS also reported on individual perceptions of safety while at home during the day. These data were not available for 2014.
Updated GSS data are not expected until 2020. In the interim, the ABS 2016 Personal Safety Survey (PSS), which uses the same measure, has been used. While not reported here, the GSS also includes a measure of experienced crime, and results indicated some similarities between perceived and experienced crime.
The Progress in International Reading Literacy Study (PIRLS) measures how safe and orderly a school is by asking teachers of those Year 4 students completing PIRLS to rate their agreement on a series of 8 statements which combine to form the Safe and Orderly School scale. This scale includes 3 statements which relate directly to safety:
- This school is located in a safe neighbourhood.
- I feel safe at this school.
- This school’s security policies and practices are sufficient.
All other questions focus on student conduct and school rules relating to conduct. This measure is used here as a proxy for neighbourhood safety.
How safe do people feel in their neighbourhood?
Most children feel safe in their neighbourhood
According to data collected as part of LSAC in 2015–16, most (91%) children aged 12–13 felt safe in their neighbourhood. Very few (<1%) did not feel safe and less than one-tenth (8%) indicated they sometimes felt safe but not all the time. This aligns relatively well with their parents’ perceptions of the neighbourhood, with 95% of their parents agreeing with the statement ‘this is a safe neighbourhood’. These results are also consistent with results from 2011–12 which found that 89% of children aged 12–13 felt safe in their neighbourhood.
Most adults with children in their household feel safe at home alone at night
According to the ABS 2014 GSS, the majority (89%) of respondents (aged 18 and over) living in households with at least 1 child aged 0–14 at home alone during the night, felt safe/very safe. Of those who walked alone in the local area during the night on their own, 65% felt safe/very safe. This pattern was similar regardless of the youngest age of the child in the household.
The proportion of respondents that felt safe/very safe at home alone during the night or walking in the local area during the night increased slightly between 2006 and 2014 (Figure 1) (ABS 2015).
Figure 1: Perceived neighbourhood safety, 2006, 2010 and 2014
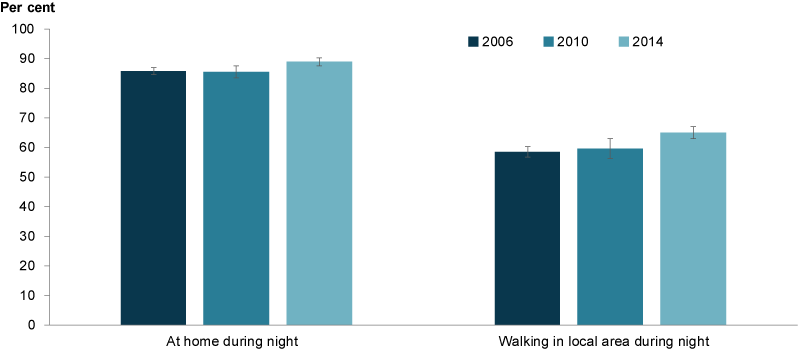
Chart: AIHW. Source: ABS 2015.
Similar to these findings, the 2016 PSS found that 92% respondents home alone after dark said they felt safe. Of those respondents who walked in the local area during the night on their own, 86% felt safe. However, 45% of all respondents indicated they did not walk in the local area alone after dark—one-third of these said it was because they did not feel safe.
Perceptions of neighbourhood safety varied depending on population groups
Respondents living in the highest socioeconomic areas were more likely to feel safe/very safe at home alone at night and walking in their local area at night compared with those living in the lowest socioeconomic areas (94% and 69% compared with 81% and 49%, respectively) (Figure 2).
Respondents born in Australia or other mainly English-speaking countries were more likely to feel safe/very safe at home at night than other respondents (90% compared with 84%). They were also more likely to feel safe/very safe walking in the local area at night (66% compared with 60%).
Figure 2: Perceived neighbourhood safety by selected population groups, 2014
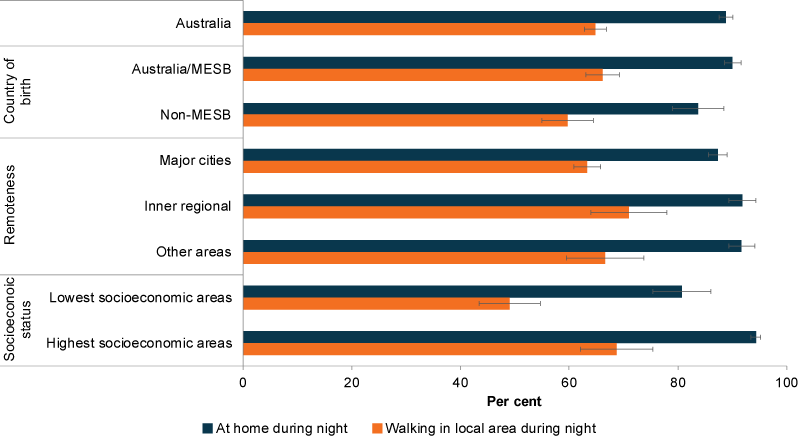
Note: Mainly English-speaking background (MESB) countries include Canada, Ireland, New Zealand, South Africa, United Kingdom and United States of America.
Chart: AIHW. Source: ABS 2015.
Safety at school
8 out of 10 teachers perceive their school to be very safe and orderly
The PIRLS 2016 found that more than three-quarters (78%) of participating Year 4 students attended schools judged by their teachers as Very safe and orderly (Figure 3). This was higher than the international average (62%).
Schools categorised as more affluent (Box 3) were more likely perceived as Very safe and orderly than schools categorised as more disadvantaged (86% compared with 61%).
Figure 3: Perceived school safety, 2016
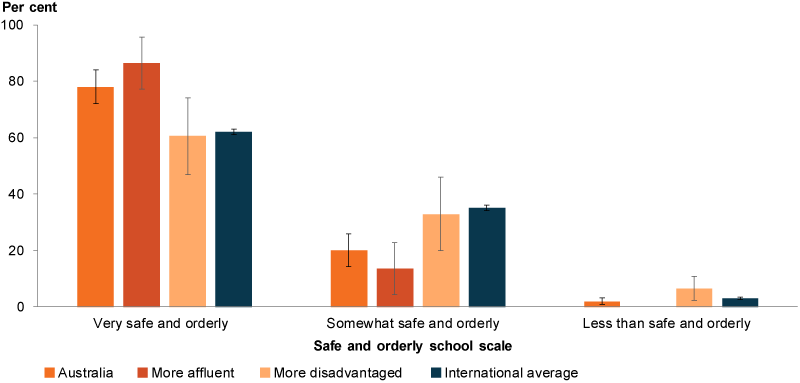
Chart: AIHW. Source: Thomson et al. 2017.
Box 3: Defining socioeconomic affluence and disadvantage in PIRLS
School principals were asked to report on the socioeconomic composition of their school by indicating what percentage of students came from economically affluent homes and what percentage came from economically disadvantaged homes. Responses were then used to create 3 categories of school socioeconomic composition:
- More affluent: more than 25 per cent of the student body comes from economically affluent homes and not more than 25 per cent from economically disadvantaged homes.
- More disadvantaged: more than 25 per cent of the student body comes from economically disadvantaged homes and not more than 25 per cent from economically affluent homes.
- Neither more affluent nor more disadvantaged: all other response combinations (Thomson et al. 2017).
Data limitations and development opportunities
National data on neighbourhood safety for children is currently limited to perceived safety reported by adults. The integration of a number of measures (perceived and/or otherwise) into an index of neighbourhood safety specifically applicable to children could provide a more complete picture. The types of measures that could be considered include access to pedestrian crossings, traffic exposure and crime statistics. A broader view of neighbourhood safety was incorporated in the Kids in Communities Study which looked at the relationship between the environment children live in and its impact on early childhood development (Goldfeld et al. 2017).
Where do I find more information?
For more information on:
- neighbourhood safety, see: Perceived safety in the National Framework for Protecting Australia’s Children.
- LSAC, see: Growing Up inGrowing Up in Australia Australia.