Australia's youth:
Body mass index
Web article
Last updated:
Topic: Children & youth
Part of Australia's youth
Citation
AIHW
Australian Institute of Health and Welfare (2021) Body mass index, AIHW, Australian Government, accessed 17 April 2024.
APA
Australian Institute of Health and Welfare. (2021). Body mass index. Retrieved from https://pp.aihw.gov.au/reports/children-youth/body-mass-index
MLA
Body mass index. Australian Institute of Health and Welfare, 25 June 2021, https://pp.aihw.gov.au/reports/children-youth/body-mass-index
Vancouver
Australian Institute of Health and Welfare. Body mass index [Internet]. Canberra: Australian Institute of Health and Welfare, 2021 [cited 2024 Apr. 17]. Available from: https://pp.aihw.gov.au/reports/children-youth/body-mass-index
Harvard
Australian Institute of Health and Welfare (AIHW) 2021, Body mass index, viewed 17 April 2024, https://pp.aihw.gov.au/reports/children-youth/body-mass-index
Key findings
In 2017–18:
- more than 1 in 4 (27%) 15–17 year olds were either overweight or obese, higher than in 1995 (20%), but similar to 2007–08 (30%)
- more than 9 in 20 (46%) 18–24 year olds were either overweight or obese, higher than in 1995 (32%) and 2007–08 (37%)
- young people aged 15–24 living in low socioeconomic areas were more likely to be overweight or obese than those living in high socioeconomic areas (49% and 32%, respectively).
A healthy body weight is important for young people’s current and future health. Being either underweight (due to under-nutrition, leading to deficiencies in calories, vitamins and minerals, and proteins) or overweight or obese (where an abnormal or excessive amount of fat accumulates in the body) increases a young person’s risk of poor physical health. Both are risk factors for future illness.
People who are very underweight are at higher risk of having osteoporosis, decreased muscle strength, hypothermia and lowered immunity (DoH 2014).
People who are overweight or obese face an increased risk of developing chronic conditions (such as type 2 diabetes and cardiovascular disease) at younger ages, and some cancers at an earlier age (Llewellyn et al. 2016; Sahoo et al. 2015; VicHealth 2014). Young people with overweight and obesity are more likely to become or remain obese as adults.
- Australian research suggests that overweight and obesity in childhood and adolescence is associated with poorer health-related quality of life, depression and low self-esteem (Sanders et al. 2015; Steinbeck et al. 2018).
- Weight-based teasing and bullying can also have an impact on a young person’s psychological wellbeing, peer relationships, school experiences and self-confidence in being physically active (Pont et al. 2017; van Geel et al. 2014).
Overweight and obesity generally results from a sustained energy imbalance, where the amount of energy consumed through eating and drinking outweighs the energy expended through physical activity and bodily functions (AIHW 2017; WHO 2002). It is influenced by a complex interplay of individual, family, community and societal factors (AIHW 2017, 2020):
- One major contributing factor is energy-dense foods that are high in fat and/or sugar, which encourage energy intake that exceeds requirements (NHMRC 2013).
- Low levels of physical activity and high levels of sedentary behaviour (such as sitting or lying down) also contribute to energy imbalance, weight gain and becoming overweight or obese (NHMRC 2013).
- Environmental factors (such as schools, workplaces, homes, food outlets, neighbourhoods and communities) can affect an individual’s energy imbalance by inhibiting or encouraging health, dietary and physical activity patterns (AIHW 2017).
- Media influences, and the availability of convenience foods, can also affect food choices (AIHW 2017).
- While genetic factors may increase an individual’s susceptibility to being overweight or obese, the increase in being overweight or obese over the past few decades suggests that socioenvironmental factors are a major contributor (NHMRC 2013).
In 2015, 8.4% of the disease burden in Australia was due to overweight and obesity; it was the second leading risk factor contributing to disease burden after tobacco use (AIHW 2019). Early intervention in childhood and adolescence is critical for preventing overweight and obesity in the population, as highlighted in the National Action Plan for the Health of Children and Young People 2020–2030 (DoH 2019).
Under Australia’s Long Term National Health Plan, the Australian Government is developing the National Preventive Health Strategy. The aim of the Strategy is to help Australians improve their health at all stages of life, through early intervention, better information, and by targeting risk factors and the broader causes of health and wellbeing (DoH 2020a). The Strategy, to be launched in 2021, will also build on other strategic work – including the National Obesity Strategy (a 10-year framework for action to reduce overweight and obesity) – to be considered by Health Ministers in 2021 (DoH 2020b).
Box 1: Data sources and definitions for weight
Data from the ABS National Nutrition Survey 1995, the National Health Survey, 2007–08, the Australian Health Survey 2011–12, and the National Health Surveys 2014–15 and 2017–18 are reported here. These surveys collected physical measurements of the height and weight of young people, excluding those living in Very remote areas.
Body mass index (BMI) is used to measure overweight and obesity. It is calculated as the ratio of weight in kilograms divided by height in metres squared (kg/m2). The measurement does not necessarily reflect body fat distribution or degree of fatness among different individuals but is a practical and useful measure for identifying overweight and obesity at a population level.
For children and adolescents (up to the age of 17), age and sex are taken into account when assessing their BMI to account for changes in their body composition as they grow. International cut-off points, based on age and sex, are used when assessing their BMI at a population level (Cole et al. 2000; Cole et al. 2007). The cut-off points used to classify adults aged 18 and over as overweight or obese are as defined by the World Health Organization (WHO 2000).
For more information on measuring overweight and obesity of children and adolescents, see Technical notes below and Appendix A: Defining and measuring overweight and obesity in Overweight and obesity among Australian children and adolescents.
In this section, child and adolescent cut-offs have been used for the 15–17 year age group, and adult cut-offs for 18–24 year olds (see Technical notes).
What is the BMI of young people?
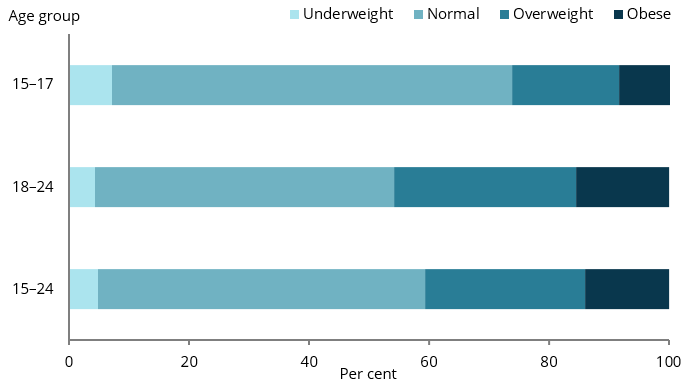
In 2017–18, among 15–17 year olds, an estimated:
- 2 in 3 (67% or 564,600) had a BMI within the normal range (Figure 1)
- more than 1 in 4 (27% or 226,800) were either overweight or obese, with 18% (or 151,300) overweight and 9.3% (or 78,300) obese
- fewer than 1 in 10 (7.2% or 60,700) were underweight (Figure 1).
Among 18–24 year olds, an estimated:
- 1 in 2 (50% or 1.1 million) had a BMI within the normal range
- slightly more than 9 in 20 (46% or 1.0 million) were overweight or obese, with 30% (or 676,700) overweight and 16% (or 347,300) obese
- 4.3% (95,400) were underweight (Figure 1).
Note that proportions and/or estimates of components do not sum due to random adjustment to avoid the release of confidential data.
Figure 1: BMI category of young people, by age group, 2017–18
Notes
- Proportions have been randomly adjusted to avoid the release of confidential data. Components do not sum to total.
- Different BMI cut-offs apply for 15–17 year olds and 18–24 year olds. See Box 1 for details.
Chart: AIHW.
Source: ABS 2019.
Do rates of being overweight or obese vary by sex?
In 2017–18, among 15–17 year olds, the proportion of males and females who were either overweight or obese was similar (30% and 24%, respectively) (Figure 2).
Among 18–24 year olds, the proportion of:
- males who were either overweight or obese was higher than that for females (52% compared with 40%) (Figure 2)
- males who were overweight (but not obese) was higher than that for females (35% compared with 26%).
Figure 2: Overweight or obese young people aged 15–24, by age group and sex, 2017–18

Note: Proportions have been randomly adjusted to avoid the release of confidential data.
Chart: AIHW.
Source: ABS 2019.
Have rates of overweight or obesity changed over time?
The proportion of young people aged 15–17 and 18–24 who are overweight or obese has increased over time.
15–17 year olds
A comparison of data from 1995 and 2007–08 found that the proportion of 15–17 year olds who were:
- overweight or obese was higher in 2007–08 than in 1995 (30% compared with 20%)
- obese was higher in 2007–08 than in 1995 (11% compared with 4.5%) (Figure 3).
Among females, the proportion who were:
- overweight or obese was higher in 2007–08 than in 1995 (29% compared with 16%)
- overweight (but not obese) was higher in 2007–08 than in 1995 (22% compared with 13%).
Among males, the proportion who were obese was higher in 2007–08 than in 1995 (15% compared with 5.9%); however, results should be treated with caution as the relative standard error (RSE) was high (see Technical notes).
Results for 2007–08 and 2017–18 were similar for all 15–17 year olds, and across both sexes.
Figure 3: Overweight or obese young people aged 15–17, 1995, 2007–08 and 2011–12 to 2017–18
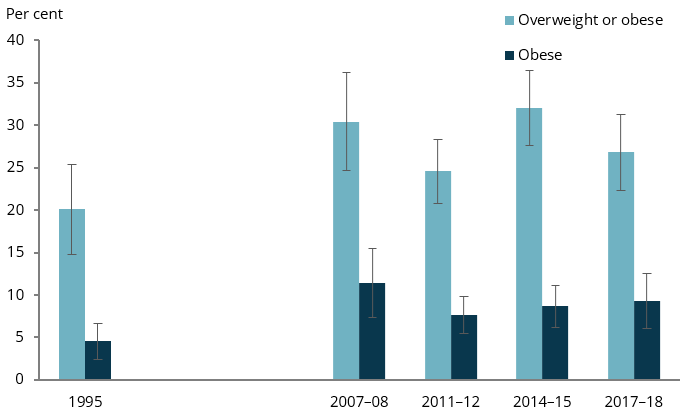
Note: Proportions have been randomly adjusted to avoid the release of confidential data.
Chart: AIHW.
Sources: ABS 2009a, 2013b, 2013c, 2016, 2019a.
18–24 year olds
A comparison of data from 1995 and 2007–08 found that the proportion of 18–24 year olds who were:
- overweight or obese was higher in 2007–08 than in 1995 (37% compared with 32%)
- obese was higher in 2007–08 than in 1995 (13% compared with 9.4%) (Figure 4).
Among females aged 18–24, the proportion who were:
- overweight or obese was higher in 2007–08 than in 1995 (35% compared with 26%)
- obese was higher in 2007–08 than in 1995 (14% compared with 8.6%).
Comparing results for 2007–08 and 2017–18, the proportion of 18–24 year olds who were:
- overweight or obese was higher in 2017–18 than in 2007–08 (46% compared with 37%) (Figure 4)
- overweight (but not obese) was higher in 2017–18 than in 2007–08 (30% compared with 24%).
Among males aged 18–24, the proportion who were:
- overweight or obese was higher in 2017–18 than 2007-08 (52% compared with 40%)
- overweight (but not obese) was higher in 2017–18 than 2007–08 (35% compared with 28%)
- obese was higher in 2017–18 than 2007–08 (18% compared with 12%).
It should be noted that different methodologies regarding respondents’ measurements of height and weight were applied for different iterations of the National Health Survey, which may have affected results (see Technical notes for more information).
Figure 4: Overweight or obese young people aged 18–24, 1995, 2007–08 and 2011–12 to 2017–18
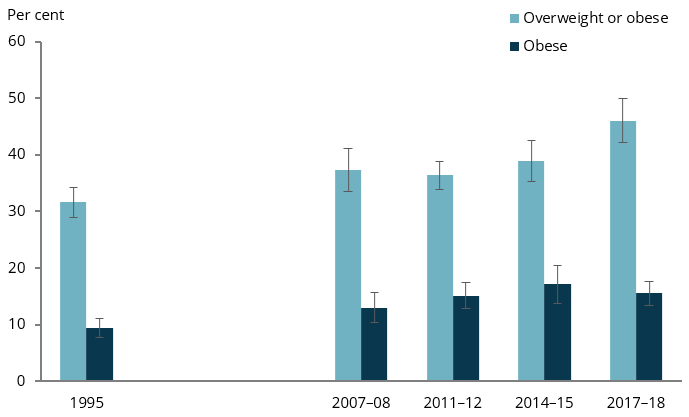
Note: Proportions have been randomly adjusted to avoid the release of confidential data.
Chart: AIHW.
Sources: ABS 2009b, 2013a, 2015, 2019a.
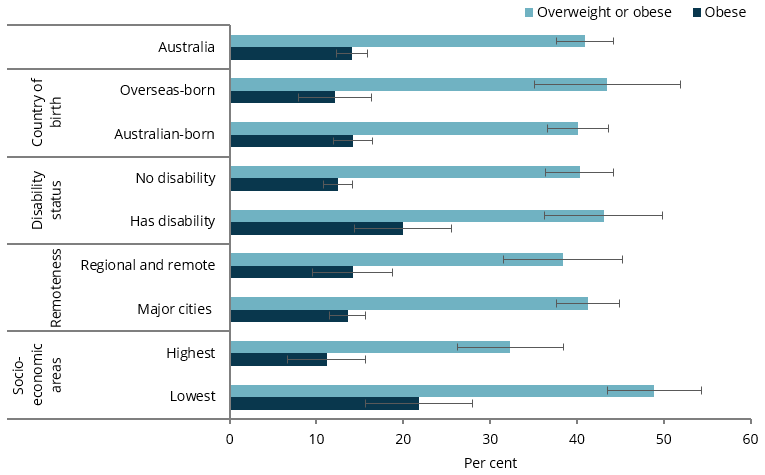
Is the prevalence of overweight and obesity the same for everyone?
In 2017–18, among young people aged 15–24:
- the proportion who were overweight or obese was higher among those living in the lowest socioeconomic areas (49%) than among those in the highest areas (32%)
- the proportion who were obese was twice as high in the lowest socioeconomic areas as in the highest areas (22% compared with 11%)
- the proportion who were obese was higher among those with disability than among those with no disability (20% compared with 13%) (Figure 5).
Figure 5: Proportion of overweight or obese young people aged 15–24, by population groups, 2017–18
Notes
- A disability or restrictive long-term health condition exists if a limitation, restriction, impairment, disease or disorder has lasted, or is expected to last, for 6 months or more, which restricts everyday activities.
- Regional and remote includes Inner regional, Outer regional and Remote areas. Remoteness Areas are based on the 2016 Australian Statistical Geography Standard.
- Socioeconomic areas are based on quintiles of the Socio-Economic Indexes for Areas (SEIFA) 2016 Index of Relative Socio-Economic Disadvantage
- Proportions have been randomly adjusted to avoid the release of confidential data.
Chart: AIHW.
Source: ABS 2019.
How does Australia compare internationally?
Based on available data for the 5–19 age group for 41 Organisation for Economic Co-operation and Development (OECD) and European Union countries, in 2016, Australia was among the 10 countries with the highest proportions (34% or more) of children and adolescents who were overweight or obese. While in Australia, the proportion was 34%, the highest proportions were in the United States (42%) and New Zealand (39%), while Greece, Malta and Italy all had 37%. Canada (32%), United Kingdom and Ireland (each 31%) had slightly lower proportions than Australia.
Lower rates tend to be found mostly in countries in northern Europe and East Asia. Japan (14%), Estonia (20%), Lithuania and Latvia (each 21%) had among the lowest proportions (UNICEF Innocenti 2020).
Where do I find more information?
For information on topics related to overweight and obesity of Australia’s youth, see:
For more information on Indigenous young people and BMI, see:
- Section 4.6, Overweight and obesity of Aboriginal and Torres Strait Islander adolescent and youth health and wellbeing 2018
- Section 2.22, Overweight and obesity of Aboriginal and Torres Strait Islander Health Performance Framework (HPF) report 2020.
For information on children and BMI, see:
- Overweight and obesity in Australia’s children
- Overweight & Obesity in Children’s Headline Indicators
- Overweight and obesity: an interactive insight
- Overweight and obesity among Australian children and adolescents.