Australia's youth:
Family relationships
Web article
Last updated:
Topic: Children & youth
Part of Australia's youth
Citation
AIHW
Australian Institute of Health and Welfare (2021) Family relationships, AIHW, Australian Government, accessed 19 April 2024.
APA
Australian Institute of Health and Welfare. (2021). Family relationships. Retrieved from https://pp.aihw.gov.au/reports/children-youth/family-relationships
MLA
Family relationships. Australian Institute of Health and Welfare, 25 June 2021, https://pp.aihw.gov.au/reports/children-youth/family-relationships
Vancouver
Australian Institute of Health and Welfare. Family relationships [Internet]. Canberra: Australian Institute of Health and Welfare, 2021 [cited 2024 Apr. 19]. Available from: https://pp.aihw.gov.au/reports/children-youth/family-relationships
Harvard
Australian Institute of Health and Welfare (AIHW) 2021, Family relationships, viewed 19 April 2024, https://pp.aihw.gov.au/reports/children-youth/family-relationships
Key findings
Overall, data from several sources indicate that family relationships are generally positive for young people.
- In 2016, almost 9 in 10 (86%) 16–17 year olds had parents who ‘accepted them as they are’.
- In 2016, over three-quarters of 16–17 year olds had parents who either understood them or asked about their problems (77%, in both instances).
- In 2018, among people aged 15–24, the mean score for satisfaction with relationships with parents on a scale of 0 to 10 was 8.2.
Although peer relationships become more important in adolescence, immediate family relationships continue to be important to young people. In 2020, almost 4 in 5 (79%) survey respondents aged 15–19 rated their family relationships as either extremely important (43%) or very important (36%) (Tiller et al. 2020).
Families also remain a key source of support during adolescence; in 2016, data from the Longitudinal Survey of Australian Children (LSAC) showed that 59% of young people aged 16–17 reported seeking support from parents, while 33% sought support from a brother or sister (see Peer relationships and social networks).
The quality of family relationships can be measured in terms of family cohesion and family conflict.
- One measure of family cohesion is the ability of family members to get along. Strong family cohesion is associated with increased ability to cope with difficult situations (AIHW 2019).
- Family conflict can range in severity from a disagreement between members to family violence. In this section, conflict is measured in terms of how often family members yell at each other. For family domestic violence, see Crime and violence.
Parents play a key role in the overall functioning of a family. Effective parenting tends to include elements of support (including the presence of warmth and lack of hostility), consistency, and interest in a child’s life (Zubrick et al. 2008).
Having a close relationship with parents during adolescence can have long-term effects. Teenagers who reported having a very close relationship with 1 or both parents during early and mid-adolescence (that is, ages 12–13 and 14–15) had higher levels of resilience at age 16–17 (Evans-Whipp & Gasser 2019). Conversely, those who experienced conflict with their parents between the ages of 12 and 15 had less resilience at age 16–17 (Evans-Whipp & Gasser 2019).
Relationships with extended family members can also play an important role in the lives of young people, but this section looks only at relationships with immediate family members. It draws on national data collections in doing so, though there is limited scope to explore differences between vulnerable groups (see Box 1 and Data gaps).
Consistent and regular national cross-sectional reporting on measures of family relationships is currently limited. A national indicator on family cohesion is included in the National Framework for Protecting Australia’s Children indicators and the Australia’s Welfare set of indicators. Both frameworks report on families’ ability to get along based on the LSAC longitudinal study in the absence of a suitable cross-sectional analysis over time. A nationally representative survey on young people could assist in addressing this data gap.
Box 1: Data sources and definitions
The Longitudinal Study of Australian Children (LSAC) is a major study that began in 2004 and follows the development of Australian children. It collects information on physical and mental health; education; and social, cognitive and emotional development. The data are sourced from parents, child carers, educators and the children themselves.
Population estimates from the LSAC represent the population of Australian children born between March 2003 and February 2004 (B cohort), and those born between March 1999 and February 2000 (K cohort). (Children had to be registered with Medicare to be included.) These two cohorts totalled more than 10,000 children at the outset of the study in 2004. (Data are not representative of children who migrated to Australia.)
The Household, Income and Labour Dynamics in Australia (HILDA) study is a nationally representative longitudinal household study that began in 2001. It follows the lives of more than 17,000 Australians each year over the course of their life. The survey collects information on many aspects of life in Australia, including household and family relationships, income and employment, and health and education. The same households and individuals are interviewed every year to see how their lives are changing over time. The survey follows not only the initial sample members for the remainder of their lives, but also their children and all subsequent descendants.
The Mission Australia Youth Survey is an opt-in survey that has been conducted annually since 2002. It asks young people aged 15–19 what concerns them; what they value; and their views of work, study and the future. In 2020, 25,800 young people participated (conducted between April and August 2020), with the majority doing so online (98%). (The remaining 2% completed the survey on paper.) Young people were engaged via schools, community organisations, through Mission Australia services and at youth events.
LSAC definition of parents/carers
In the LSAC, Parent 1 (referred to in this section as the primary carer) is defined as the parent who knows most about the child (not necessarily a biological parent). Parent 2 (referred to in this section as the secondary carer), if there is one, is defined as another person in the household with a parental relationship to the child, or the partner of Parent 1 (not necessarily a biological parent).
Variation across population groups
While both the LSAC and the HILDA include variables to support the disaggregation of data by remoteness and socioeconomic areas, in many cases findings were not statistically significant, and so are not reported here. This may be in part due to small sample sizes.
How well do families get along?
In 2016, based on data from the LSAC, most young people aged 16–17 regarded their family’s ability to get along with one another as good, very good or excellent (85% or 203,000) (see Technical notes).
Overall, the views of carers aligned with the views of young people. Around 9 in 10 primary and secondary carers (90% or 216,000 and 95% or 114,000, respectively) regarded their family’s ability positively.
Whether a family yells at each other can be viewed as a measure of family conflict. Based on the LSAC, it is estimated that:
- for almost half (47% or 113,000) of 16–17 year olds, family members never or hardly ever yelled at each other
- for 1 in 6 (16% or 37,800), yelling often or always occurred between family members.
Results from the Mission Australia 2020 Youth Survey report on young people’s families’ ability to get along among a broader age group (that is, among young people aged 15–19) were slightly lower:
- nearly 8 in 10 young people rated this aspect positively (79%) as being either excellent (23%), very good (32%) or good (24%)
- more than 1 in 5 (22%) rated their family’s ability to get along as being either fair (15%) or poor (6.9%) (Tiller et al. 2020).
Between 2012 and 2020, the proportion of young people aged 15–19 who rated their families’ ability to get along as excellent, very good or good ranged from 82% in 2018 to 78% in 2019. Results for 2019 and 2020 were very similar (78.2% and 78.5%, respectively) (Mission Australia 2012; Tiller et al 2020).
Is it the same for everyone?
Families’ ability to get along did vary, depending on where the young people lived. Based on LSAC data, the proportion of young people aged 16–17 who regarded their family’s ability to get along with one another as good, very good or excellent was:
- highest in Outer regional areas (89%) compared with Major cities (86%) and Inner regional areas (81%)
- higher for young people living in the highest socioeconomic areas compared with the lowest socioeconomic areas (91% compared with 82%).
Results from the Mission Australia 2019 Youth Survey Disability Report found that among young people aged 15–19 with disability:
- a lower proportion rated their family’s ability to get along positively (64%) compared with young people without disability (79%)
- over 1 in 3 (36%) rated their family’s ability to get along as either fair or poor compared with 1 in 5 (21%) of participants without disability (Hall et al. 2020).
How many parents are consistent in their parenting?
In 2016, based on LSAC self-reported data on consistent parenting (see Box 2), the majority of primary and secondary carers to young people aged 16–17 provided consistent parenting about half the time or more often (91%), respectively.
Box 2: Measuring consistent parenting
The LSAC wave 7 includes a consistent parenting scale with a series of 5 questions answered on a scale of 1 to 5:
- When you give this child an instruction or make a request to do something, how often do you make sure that he/she does it?
- If you tell this child he/she will get punished if he/she doesn’t stop doing something, but he/she keeps doing it, how often will you punish him/her?
- How often does this child get away with things that you feel should have been punished?
- How often is this child able to get out of punishment when he/she really sets his/her mind to it?
- When you discipline this child, how often does he/she ignore the punishment?
A score of 3 or higher indicates that parents provide consistent parenting about half the time or more often (Duffy et al. 2020). For more details, see Technical notes.
In 2016, based on LSAC self-reported data on parenting behaviours from the angry parenting scale (see Box 3), primary carers of 16–17 year olds engaged in the following selected behaviours for half the time or more:
- almost 9 in 10 (87%) engaged in praising behaviour
- more than 1 in 4 disapproved of the young person’s behaviour (27%)
- more than 1 in 4 were angry when punishing the young person (27%)
- just over 1 in 6 (17%) decided on a level of punishment depending on their mood
- just over 1 in 10 (12%) had problems managing the young person
- only a small proportion (2.9%) told the young person that they were not as good as others.
Box 3: Measuring angry parenting behaviours
The LSAC wave 7 includes data collected using an angry parenting scale which comprises a series of 5 questions answered on a scale of 1 to 5. For each of the following questions, parents/carers were asked to indicate how often the following happens:
- How often do you get annoyed with this child for saying or doing something he/she is not supposed to do?
- Of all the times you talk to this child about his/her behaviour, how often is this praise?
- Of all the times you talk to this child about his/her behaviour, how often is this disapproval?
- How often are you angry when you punish this child?
- How often do you feel you are having problems managing this child in general?
- How often do you tell this child that he/she is bad or not as good as others?
- How often do you think that the level of punishment you give this child depends on your mood?
In this section, selected individual items from the angry parenting scale are reported based on a score of 3 or higher to indicate that parents/carers engaged in these behaviours half the time or more. For more details, see Technical notes.
How well do 16–17 year olds get along with parents?
In 2016, based on the parent trust scale data from the LSAC, among young people aged 16–17, more than 4 in 5 reported that it was almost always/always or often true that:
- their parents accepted them as they are
- they trusted their parents
- they could count on their parents to help when they had a problem
- their parents paid attention to them (Figure 1).
Seventy-seven per cent of young people aged 16–17 reported that it was almost/always or often true that their parents understood them.
The proportions of young people for whom the following 3 items from the parent communication scale were almost always/always or often true were generally a little lower than for trust, ranging between 61% and 77% (Figure 1):
- the young people talk to their parents when they have a problem
- if their parents know that something is bothering the young people, their parents ask them about it
- the young people shared their thoughts and feelings with their parents.
Figure 1: How well young people (aged 16–17) get along with parents, 2016
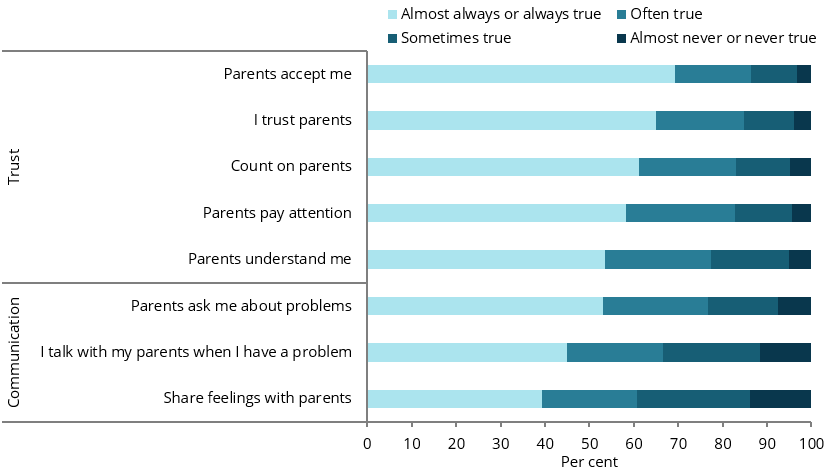
Chart: AIHW.
Source: AIHW analysis of the LSAC Wave 7.
Higher proportions of young people living in the highest socioeconomic areas provided positive responses on all of the measures on relationships with parents compared with those living in the lowest socioeconomic areas. The difference between the 2 groups ranged from 5 percentage points for trusting their parents to 12 percentage points for counting on their parents (Box 4). An exception was the measure for sharing feelings with parents, which was similar for both groups.
Box 4: Measuring trust and communication with parents
The LSAC wave 7 includes data collected using the parent trust and communication scale from the People in My Life measure. Young people were asked to respond to the following statements:
- My parents accept me as I am.
- My parents understand me.
- I trust my parents.
- I can count on my parents to help me when I have a problem.
- My parents pay attention to me.
- I talk with my parents when I have a problem.
- If my parents know that something is bothering me, they ask me about it.
- I share my thoughts and feelings with my parents (Duffy et al. 2020).
In this section, individual items from the parent trust scale and parent communication scale are reported individually, based on young people’s responding that the statement was almost always/always or often true. For more details, see Technical notes.
How satisfied are 15–24 year olds with their relationship with parents?
In 2018, the HILDA survey asked participants to indicate how satisfied or dissatisfied they currently were with their parents on a scale of 0 (completely dissatisfied) to 10 (completely satisfied).
- Among people aged 15–24, the mean satisfaction score was 8.2, and was similar for males and females (8.3 and 8.1, respectively), and age groups 15–19 years and 20–24 years (8.3 and 8.2, respectively).
- Young people aged 15–19 who did not live with their parents had a lower mean satisfaction score (7.1 compared with that of their peers who lived with their parents (8.3).
- Between 2008 and 2018, the mean satisfaction score for young people aged 15–24 has remained stable (Figure 2).
Figure 2: Satisfaction of young people (aged 15–24) with relationship with parents, by living arrangements, 2018
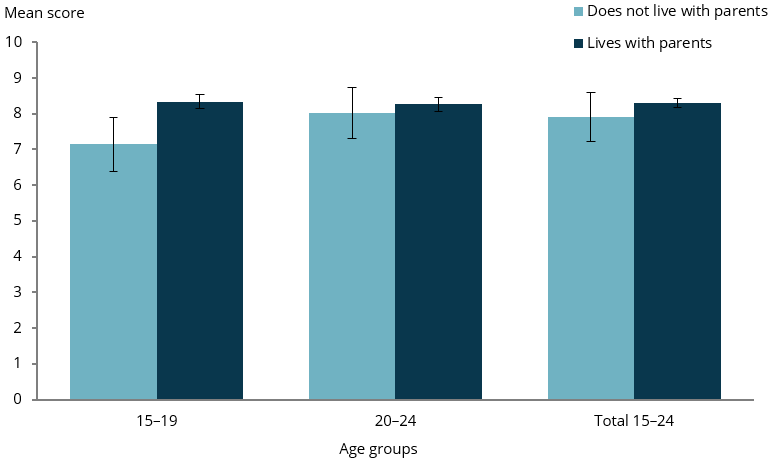
Chart: AIHW.
Source: AIHW analysis of the HILDA.
Where do I find more information?
For information on topics related to family relationships in Australia’s youth, see:
- Crime and violence for family domestic violence
For information on Indigenous young people and contact with family, see:
- Section 3.5 ‘Social support’ of Aboriginal and Torres Strait Islander adolescent and youth health and wellbeing 2018
For information on children and family relationships, see:
- Families in Australia’s children.