Australia's youth:
Infectious diseases
Web article
Last updated:
Topic: Children & youth
Part of Australia's youth
Citation
AIHW
Australian Institute of Health and Welfare (2021) Infectious diseases, AIHW, Australian Government, accessed 25 April 2024.
APA
Australian Institute of Health and Welfare. (2021). Infectious diseases. Retrieved from https://pp.aihw.gov.au/reports/children-youth/infectious-diseases
MLA
Infectious diseases. Australian Institute of Health and Welfare, 25 June 2021, https://pp.aihw.gov.au/reports/children-youth/infectious-diseases
Vancouver
Australian Institute of Health and Welfare. Infectious diseases [Internet]. Canberra: Australian Institute of Health and Welfare, 2021 [cited 2024 Apr. 25]. Available from: https://pp.aihw.gov.au/reports/children-youth/infectious-diseases
Harvard
Australian Institute of Health and Welfare (AIHW) 2021, Infectious diseases, viewed 25 April 2024, https://pp.aihw.gov.au/reports/children-youth/infectious-diseases
Key findings
- In 2020, notification rates for almost all vaccine preventable diseases included in this section were the lowest in 11 years.
- Between 2009 and 2020, the rate for influenza has fluctuated, with the highest rate in 2019 followed by the lowest in 2020 for both young people aged 15–19 (1,213 and 57 per 100,000, respectively) and 20–24 year olds (1,012 and 59 per 100,000, respectively).
- The rate of chlamydia notifications for young people aged 20–24 increased between 2009 and 2019 (1,466 to 1,934 per 100,000) before dropping sharply in 2020 (to 1,415 per 100,000).
Infectious (also known as communicable) diseases are illnesses or diseases caused by infectious organisms or their toxic products. These diseases pass to humans, directly or indirectly, through contact with other humans, animals, or other environments where the organisms are found. They can be caused by bacteria, viruses, parasites of fungi, or their toxic products (AIHW 2020a).
Vaccination is one of the key public health measures that has been greatly successful in reducing infections from serious diseases and in decreasing related disability and death.
- Vaccinations are both a powerful and cost-effective tool, having eradicated smallpox and assisted in widespread elimination of poliomyelitis.
- When enough people are immunised against an infection to stop it spreading, those not immunised are also protected – a method referred to as ‘herd immunity’ (AIHW 2020a; Orenstein & Ahmed 2017; WHO 2016).
Infection with a communicable disease is something most people will experience in their lifetime; these diseases are mostly mild and short lived. Medical assistance, including testing, is not needed or sought in many cases, and therefore the prevalence of these diseases is difficult to determine.
Some diseases must be reported to health authorities, called notifiable diseases, and this allows public health interventions to be introduced to reduce or prevent transmission (AIHW 2020a). Notifiable diseases can vary between states and territories but are generally identified based on the potential severity of harm and/or risk of spread (for national, state and territory lists of notifiable diseases, see Where do I find more information?).
COVID-19 is a disease caused by the coronavirus SARS-CoV-2. By early February 2020, it was declared a notifiable disease in all states and territories in Australia (Widmaier 2020). It was declared a pandemic by the World Health Organization on 11 March 2020 (WHO 2020).
The COVID-19 pandemic has had an impact on almost all aspects of young people’s lives and caused substantial harm worldwide. The measures adopted to control its spread (including social distancing) are likely to have also affected the spread of other infectious diseases. However, the extent to which this occurred is difficult to quantify due to other factors that would have had an impact on notification numbers, such as changes in health care seeking behaviour and laboratory testing priorities (Bright et al. 2020).
Australia’s COVID-19 Vaccine National Rollout Strategy identifies priority populations and phases for the vaccination program (DoH 2021a).
- Young people aged 15–24 are not a priority population and, as at April 2021, the Pfizer/BioNTech vaccine has been only provisionally approved for individuals 16 years and older (DoH 2021b).
- However, young people aged 16 and over who live in residential disability and aged care or work as quarantine and border workers, frontline health‑care workers and aged care and disability care staff are considered a first priority population and will receive vaccinations in the first phase of the national roll-out (Morrison 2021). For more details, see COVID-19 and the impact on young people.
This section focuses on several infectious diseases of particular relevance to young people, including those for which there is a national immunisation program.
Box 1: Data sources for infectious diseases
National Notifiable Diseases Surveillance System
Data on rates of notifiable diseases come from the National Notifiable Diseases Surveillance System (NNDSS), which coordinates the national surveillance of more than 50 communicable diseases or disease groups. Under the NNDSS, doctors, diagnostic laboratories and hospitals are required by law to notify their state or territory health authority when cases of particular communicable diseases are identified. Every day these data are collated, analysed and published on the internet by the Department of Health (DoH 2020a).
The number of notifications over time can be influenced by increased testing or more sensitive diagnostic tools. Also, not all people with notifiable diseases present for medical care and, for those who do, not all are tested. Thus, notifications represent a portion of all cases in the community (for other causes of variability in notifications, see Technical notes) (AIHW 2018a, 2018b; DoH 2015a).
National HIV surveillance data
National data for human immunodeficiency virus (HIV) come from The Kirby Institute, which conducts research of infectious diseases, including HIV, sexually transmissible infections (STIs) and viral hepatitis. These data are collated, analysed and published in annual surveillance reports and online (see also Where do I find more information?).
Australian Immunisation Register
National data on the rates of immunisation for human papillomavirus (HPV) up to 2017 come from a collection of historical data from the National HPV Vaccination Program Register, which ceased to operate on 31 December 2018 (DoH 2020b). Since then, HPV vaccination data have been recorded in the Australian Immunisation Register (AIR). HPV vaccination coverage rates after 2017 will be included in the 2020 annual immunisation coverage report, which at the time this report was written had not been released (Hull et al. 2020).
The AIR includes vaccines funded under the National Immunisation Program (NIP). A series of vaccinations are given at specific times throughout a person’s life. The NIP provides free vaccines to eligible people (including babies, young children, teenagers and older Australians) to help reduce diseases that can be prevented by vaccination.
The NIP schedule is subject to change. For the most recent schedule, see National Immunisation Program Schedule.
How common are vaccine preventable diseases?
A vaccine preventable disease is an infectious disease that can either be prevented or have its impact reduced by immunisation, generally through a vaccine (AIHW 2019a). Large-scale immunisation programs, such as Australia’s National Immunisation Program Schedule, and other public health measures have resulted in a substantial decrease in the incidence of such diseases.
This section examines selected vaccine preventable diseases: influenza, pertussis, pneumococcal diseases, meningococcal diseases, mumps, measles, rubella and chickenpox. For detailed definitions of each disease, see Where do I find more information?.
In 2020, notifications of vaccine preventable diseases among young people aged 15–24 varied by age, sex and disease (see Technical notes):
- Influenza accounted for the vast majority of notifications for young people aged 15–24 (1,883 notifications), with more notifications for females than males (965 compared with 914) and 4 notifications with sex recorded as unknown.
- Pertussis (whooping cough) was more common in young people aged 15–19 than in 20–24 year olds (227 notifications compared with 170 notifications).
- Chickenpox was more common among males than females (159 notifications compared with 140 notifications).
- Other vaccine preventable diseases were relatively uncommon:
- Measles (4 notifications)
- Pneumococcal disease (31 notifications)
- Meningococcal disease (19 notifications)
- Mumps (37 notifications)
- Rubella (0 notifications).
How have vaccine preventable diseases changed over time?
Between 2009 and 2020, the notification rate of vaccine preventable diseases among young people aged 15–19 and 20–24 varied greatly by disease type, with similar patterns seen between age groups. However, influenza and pertussis (whooping cough) have consistently had the highest notification rates.
In 2020, nearly all vaccine preventable diseases considered in this section had the lowest notification rates reported in 11 years (except for chickenpox and mumps). As already noted, it is difficult to determine how much of this decrease reflects a real drop in the number of cases occurring, and how much relates to changes in health care seeking and in testing associated with the COVID-19 pandemic.
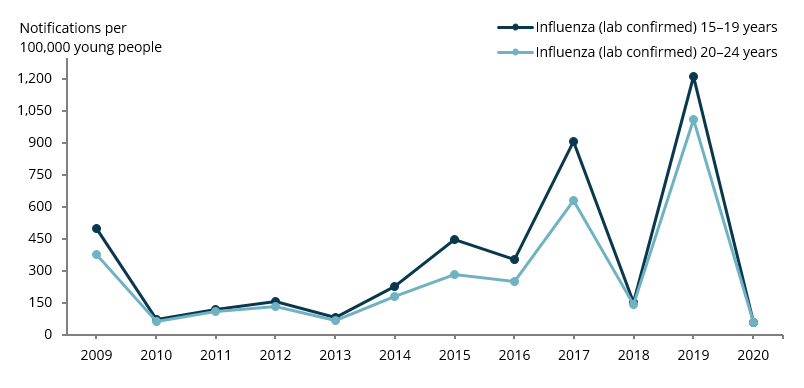
Changes for influenza
The rate has fluctuated over time, with the highest rate in the last 10 years in 2019, followed by the lowest in 2020 for both young people aged 15–19 (1,213 and 57 per 100,000, respectively) and those aged 20–24 (1,012 and 59 per 100,000, respectively) (Figure 1).
Figure 1: Rate of notifications for influenza among young people aged 15–19 and 20–24, 2009–2020
Note: All NNDSS data were extracted January 2021, see Technical notes.
Chart: AIHW.
Source: DoH 2020a.
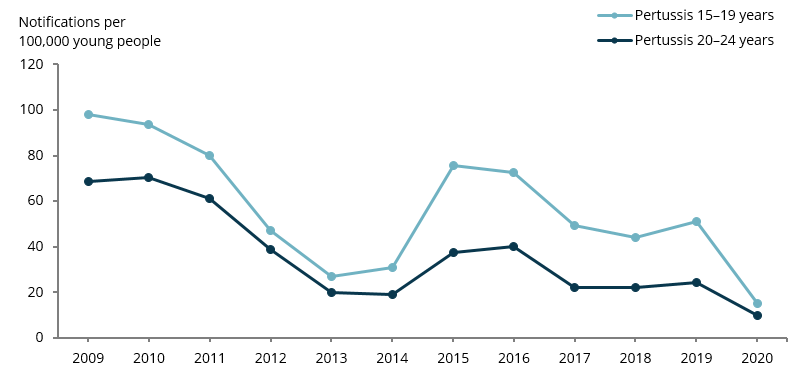
Changes for pertussis (whooping cough)
The rate decreased between 2009 and 2013 for both age groups, and then peaked in 2015–2016, with:
- 76 notifications per 100,000 for 15–19 year olds in 2015 and 40 per 100,000 for 20–24 year olds in 2016
- notification rates reaching their lowest point in 2020 in over 10 years for both 15–19 year olds (15 per 100,000) and 20–24 year olds (10 per 100,000) (Figure 2).
Figure 2: Rate of notifications for pertussis (whooping cough) among young people aged 15–19 and 20–24, 2009–2020
Note: All NNDSS data were extracted January 2021, see Technical notes.
Chart: AIHW.
Source: DoH 2020a.
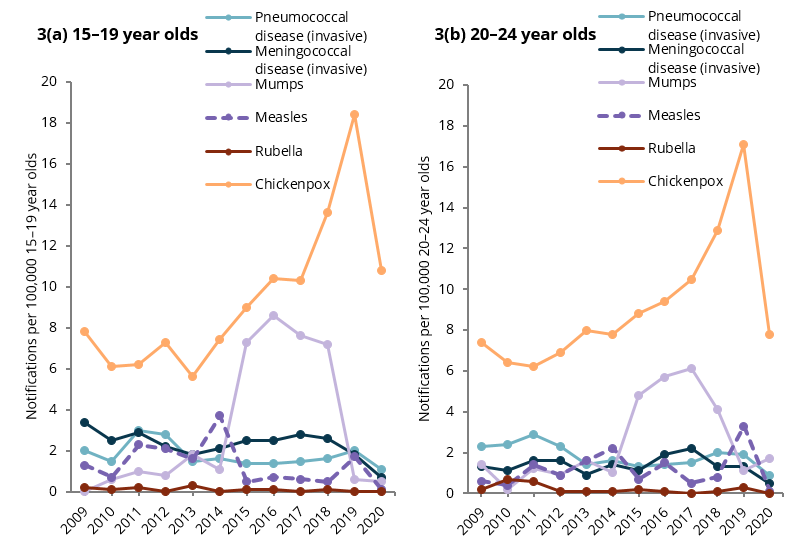
Changes for some other vaccine preventable diseases
Chickenpox: outbreaks still consistently occur. The notification rates generally increased between 2009 and 2019 for 15–19 year olds (from 8 to 18 per 100,000, respectively) and for 20–24 year olds (7 to 17 per 100,000, respectively). In 2020, there was a large drop in notification rates for both age groups (to 11 and to 8 per 100,000, respectively)
Mumps: a major outbreak occurred in 2015, with:
- the notification rates rising substantially between 2014 and 2015 (from around 1 notification per 100,000 for both age groups to 7 and 5 per 100,000 for 15–19 and 20–24 year olds, respectively) (AIHW 2018)
- the rates remained high until 2019 after which they returned to 0–2 notifications per 100,000. From 2019 to 2020, the notification rate increased for 20–24 year olds (from 1 to 2 per 100,000)
Meningococcal disease (invasive), pneumococcal disease (invasive), measles and rubella: the rates have remained consistently low (under 5 per 100,000) for 15–19 year olds and 20–24 year olds (figures 3a and 3b).
In 2018, a new meningococcal vaccine covering 4 sub-types was added to the NIP for infants in response to the severity of the disease and recent increases in notifications and deaths (DoH 2018a; Hunt 2018). The vaccine used before this covered only 1 meningococcal disease sub-type.
In 2019, a dose was added to the NIP for 14–16 year olds to be provided under a school-based program (DoH 2019). An ongoing catch-up program also provided a free dose for those aged 15–19 who missed receiving the vaccine at school through their general practitioner or primary care provider (DoH 2019).
Figures 3: Rate of notifications for selected vaccine preventable diseases among young people aged 15–19 and 20–24, 2009–2020
Note: All NNDSS data were extracted January 2021, see Technical notes.
Chart: AIHW.
Source: DoH 2020a.
How common is viral hepatitis and how has this changed over time?
Hepatitis is the inflammation of the liver and has non-viral and viral causes (AIHW 2020a).
- Hepatitis B and C are blood-borne viruses that can lead to chronic liver damage and liver cancer.
- They can spread between people via infected blood and bodily fluids containing blood (for example, through unprotected sex or intravenous drug use) or from parent to child during birth (WHO 2019).
- Hepatitis B is also a vaccine preventable disease and is included in the National Immunisation Program Schedule. For detailed definitions of each type of hepatitis, see Where do I find more information?.
Notification rates for hepatitis may underestimate the number of infections due to some people having no symptoms and not seeking testing and some not meeting the ‘newly acquired’ case definition (see Technical Notes) (AIHW 2018c).
Notifications of viral hepatitis
In 2020, among young people aged 15–24:
- there were more notifications of newly acquired hepatitis C than B (235 compared with 15)
- both hepatitis B and C were more common in males than females (10 and 5, respectively, for hepatitis B, and 202 and 33, respectively, for hepatitis C)
- newly acquired notifications of hepatitis B and C were more common among 20–24 year olds than 15–19 year olds (13 and 2, respectively, for hepatitis B, and 191 and 44, respectively, for hepatitis C) (DoH 2020a).
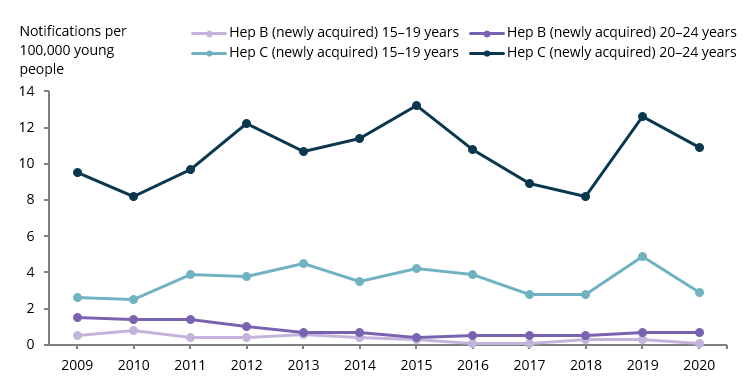
Changes for viral hepatitis
From 2009 to 2020, among young people aged 15–19 and 20–24, the notification rates for newly acquired hepatitis B and C have generally remained the same, with larger variations year to year for hepatitis C:
- From 2018 to 2019, the notification rate of hepatitis C per 100,000 increased for both 15–19 year olds and 20–24 year olds (from 3 to 5 and from 8 to 13, respectively).
- The notification rate decreased again in 2020 (to 3 and 11 per 100,000, respectively for 15–19 year olds and 20–24 year olds, respectively) (Figure 4).
As noted earlier, it is difficult to determine how much of this decrease reflects a real drop in the number of cases occurring, and how much it relates to changes in health care seeking and in testing associated with the COVID-19 pandemic.
Figure 4: Rate of notifications for hepatitis B and C among young people aged 15–19 and 20–24, 2009–2020
Note: All NNDSS data were extracted January 2021, see Technical notes.
Chart: AIHW.
Source: DoH 2020a.
How common are sexually transmissible infections and how has this changed over time?
STIs are infections that can be passed from one person to another by sexual contact (AIHW 2020a). Young people are disproportionately represented in the number of notifications in a given year. In 2016, 75% of all chlamydia notifications occurred in young people aged 15–29 (DoH 2018b). However, there are barriers to young people accessing prevention, testing, treatment and support for STIs. These include:
- personal barriers, such as underestimating the risk or seriousness of STIs
- social barriers, including the fear of stigmatisation
- structural barriers, such as financial cost (DoH 2018b).
Infections may also be asymptomatic, which can reduce the number of infected people who seek testing and treatment (DoH 2018b). This section examines 3 STIs: chlamydia, gonorrhoea and syphilis. For detailed definitions of each, see Where do I find more information?
Notifications of STIs
In 2020, based on data from the NNDSS, among young people aged 15–24:
- there were nearly 5 times as many notifications of chlamydia as other STIs (37,500 compared with 7,700 for gonorrhoea and 871 for syphilis)
- chlamydia was around twice as common in females as males (23,900 notifications compared with 13,500)
- gonorrhoea and syphilis were more common in males than females (4,200 notifications compared with 3,500 for gonorrhoea and 546 compared with 324 for syphilis)
- there were around twice as many notifications of each STI in 20–24 year olds as in 15–19 year olds:
- 24,800 compared with 12,700 for chlamydia
- 5,300 compared with 2,300 for gonorrhoea
- 589 compared with 282 for syphilis
- among 15–19 year olds, chlamydia and gonorrhoea were more common in females than males (for chlamydia, 9,200 notifications compared with 3,500; for gonorrhoea, 1,300 compared with 986).
Changes for STIs
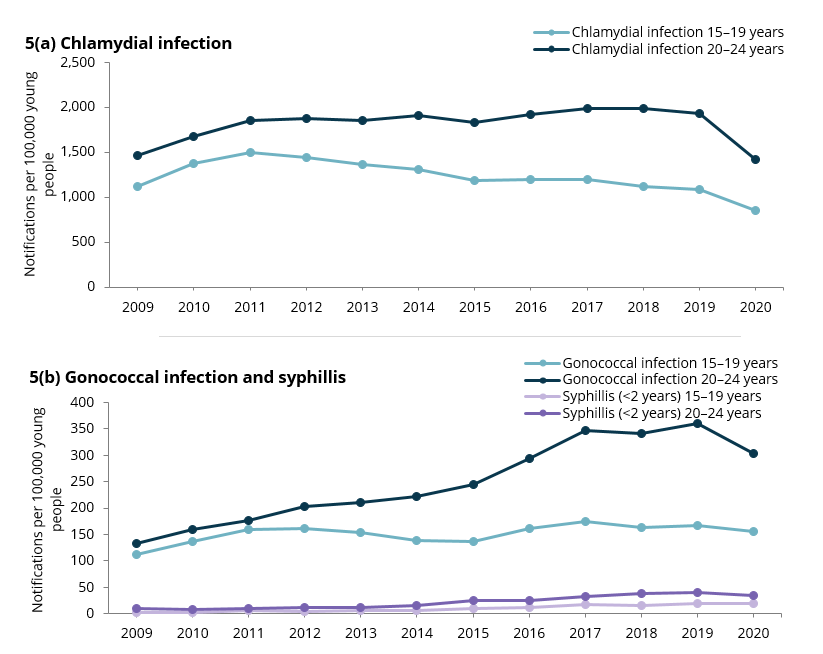
From 2009 to 2020, among young people:
- the notification rate of chlamydia for:
- 15–19 year olds fell from 1,117 per 100,000 young people in 2009 to 846 per 100,000 in 2020, after a peak of 1,500 in 2011
- 20–24 year olds rose from 2009 to 2019 (1,466 to 1,934 per 100,000) with a sharp decrease in 2020 to 1,415 (Figure 5a)
- the notification rate of gonorrhoea for:
- 15–19 year olds has ranged between 112 to 174 per 100,000, with 156 in 2020
- 20–24 year olds steadily increased from 2009 to 2019, from 134 to 359 per 100,000, before decreasing in 2020 to 304 (Figure 5b)
- the notification rate of syphilis increased by more than 4 times for both 15–19 year olds and 20–24 year olds between 2009 and 2018 (from 3 to 15 per 100,000 and from 10 to 39 per 100,000, respectively) and has remained at similar rates since (Figure 5b).
As has already been noted, it is difficult to determine how much the changes in notifications in 2020 reflect real changes in the number of cases occurring, and how much they relate to changes in health care seeking and testing associated with the COVID-19 pandemic.
Figure 5: Rate of notifications for selected STIs among young people aged 15–19 and 20–24, 2009–2020
Note: All NNDSS data were extracted January 2021, see Technical Notes .
Chart: AIHW.
Source: DoH 2020a.
How common is human immunodeficiency virus and how has this changed over time?
Notifications of HIV
In 2019, based on data from The Kirby Institute, among young people aged 15–24, there were 91 HIV notifications:
- Young people aged 20–24 had more than 10 times as many notifications as those aged 15–19 (84 compared with 7).
- Males had more than 10 times as many notifications as females (83 compared with 7) (The Kirby Institute, unpublished; see also Where do I find more information?).
The majority of HIV notifications were reported with the exposure classification of male-to-male sexual contact (66 notifications). Other notifications were reported with their HIV exposure classified as:
- heterosexual contact (14 notifications)
- male-to-male sexual contact and injecting drug use (8 notifications)
- other or undetermined causes (3 notifications) (The Kirby Institute, unpublished).
Changes for HIV
Between 2008 and 2019, the rate of notifications among young people aged 15–24 varied, with consistently higher rates for males then females (Figure 6).
Figure 6: Rate of notifications for HIV among young people aged 15–24, by sex, 2008–2019
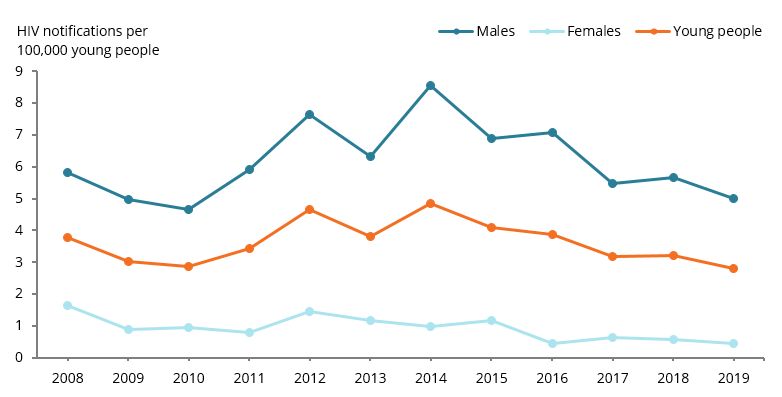
Chart: AIHW.
Source: The Kirby Institute, unpublished
Between 2008 and 2019, the number of notifications among young people aged 15–24 attributed to:
- male-to-male sexual contact increased from 75 cases in 2008 to 125 cases in 2014, then gradually decreased to 66 in 2019
- heterosexual contact decreased from 34 to 14 cases (The Kirby Institute, unpublished).
How many young people are vaccinated against human papillomavirus and how has this changed over time?
HPV, a highly contagious virus transmitted through sexual contact, is the cause of most cervical cancers (Brotherton et al. 2019). The HPV vaccination was introduced in mid-2007 for all females aged 12–26 until the end of 2009.
- After this, it was routinely offered to females in the first year of high school (usually at age 12–13). From 2013, it was also routinely offered to males in the first year of high school (at age 12–13).
- A catch-up program was made available in 2013 and 2014 for males aged 14–15.
As the age of a student in the first year of high school can vary across Australia, age 15 is used as the routine age to review how many students are fully vaccinated (HPV 3 dose vaccination, see Technical notes ) (DoH 2020c).
There has been insufficient time since HPV vaccinations were introduced for the cervical cancer data to show its effects (AIHW 2019b). High-grade abnormalities can develop from HPV and are associated with future cervical cancer. In a study of a cohort of women born in 1992 or later, the incidence of high-grade abnormalities was found to be lower in HPV-vaccinated women than in unvaccinated women (between 2007 and 2014) (AIHW 2019b).
In 2017, 80% of females and 76% of males turning 15 were fully vaccinated for HPV.
Since 2007, the proportion of females and males who received the vaccinations has increased for females (from 74% in 2007 to 80% in 2017) and for males (from 30% in 2013 to 76% in 2017) (Figure 7).
Figure 7: Proportion of young people turning 15 who were fully vaccinated for HPV, 2007 to 2017
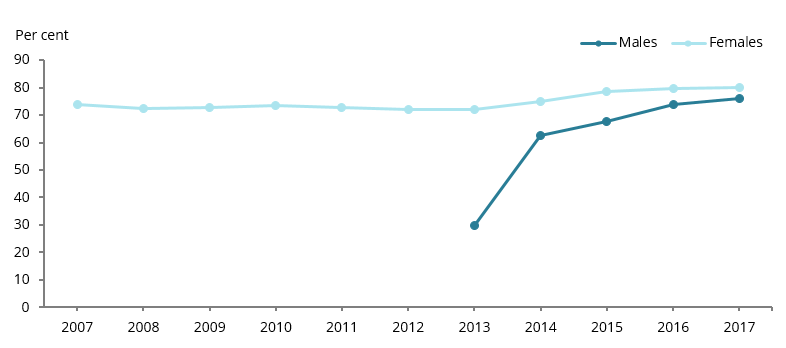
Note: In 2013, some 15 year olds were eligible for catch-up vaccination as part of the 2013–14 male HPV vaccination catch-up program.
Chart: AIHW.
Source: DoH 2020b.
Deaths attributed to infectious diseases
There were 6 deaths among young people aged 15–24 in 2018 that were attributed to the vaccine preventable diseases influenza and pneumococcal disease (AIHW 2020b).
Where do I find more information?
For information on Indigenous young people and infectious diseases, see:
- Section 1.12, HIV/AIDS, hepatitis & sexually transmissible infections, and Section 3.02, Immunisation of Aboriginal and Torres Strait Islander Health Performance Framework (HPF) report 2020
- Section 7.9, Infectious diseases of Aboriginal and Torres Strait Islander adolescent and youth health and wellbeing 2018.
For more information on:
- national and state and territory lists of notifiable diseases, see Notification of illness and disease
- national data related to HIV, hepatitis B and C, and STIs see the The Kirby Institute website
- the definitions for vaccine preventable diseases and STIs, see the NNDSS PHLN laboratory case definitions
- the definitions of hepatitis A, B and C and HIV, see the Healthdirect website
- Australian students’ behaviours, knowledge and education of STIs and HPV, see the National Survey of Secondary Students and Sexual Health 2018.