Australia's youth:
Bullying and negative online experiences
Web article
Last updated:
Topic: Children & youth
Part of Australia's youth
Citation
AIHW
Australian Institute of Health and Welfare (2021) Bullying and negative online experiences, AIHW, Australian Government, accessed 19 April 2024.
APA
Australian Institute of Health and Welfare. (2021). Bullying and negative online experiences. Retrieved from https://pp.aihw.gov.au/reports/children-youth/negative-online-experiences
MLA
Bullying and negative online experiences. Australian Institute of Health and Welfare, 25 June 2021, https://pp.aihw.gov.au/reports/children-youth/negative-online-experiences
Vancouver
Australian Institute of Health and Welfare. Bullying and negative online experiences [Internet]. Canberra: Australian Institute of Health and Welfare, 2021 [cited 2024 Apr. 19]. Available from: https://pp.aihw.gov.au/reports/children-youth/negative-online-experiences
Harvard
Australian Institute of Health and Welfare (AIHW) 2021, Bullying and negative online experiences, viewed 19 April 2024, https://pp.aihw.gov.au/reports/children-youth/negative-online-experiences
Key findings
- In 2019, just over 1 in 5 (21%) young people aged 15–19 reported experiencing bullying in the previous 12 months.
- In 2020, just over 4 in 10 (44%) young people aged 12–17 had at least 1 negative online experience in the 6 months prior to September.
- In 2017, experience with sexting (either consensual or non-consensual) among young people aged 14–17 was more common among females than males (35% and 22%).
Bullying is the repeated and intentional use of words or actions against someone or a group of people to cause distress and risk to their wellbeing. It usually occurs when the perpetrator has more influence or power over someone else or wants to make someone else feel less powerful or helpless (AHRC 2012).
Bullying comes in various forms:
- physical (including hitting or otherwise hurting someone)
- verbal (including name calling or insulting someone)
- social (such as constantly excluding someone or sharing information or images that will have a harmful effect on the other person).
Bullying can be overt or covert and can happen face to face or online (cyberbullying) (Australian Education Authorities 2020).
Cyberbullying has been defined as ‘the use of technology to bully a person or group with the intent to hurt them socially, psychologically or even physically’ (eSafety Commissioner 2018b). Cyberbullying shares many features of traditional bullying but has some key differences. It can:
- be done anonymously
- make harmful material continuously accessible, easily copied and distributed widely, and difficult to remove (AHRC 2012; eSafety Commissioner 2018a; United Nations Children’s Fund 2014).
The digital environment has also given rise to sexting: the sending, receiving, requesting or being asked for mostly, but not always, self-generated nude or nearly nude images or video through digital tools and/or platforms (SWGFL/UK Safer Internet Centre et al. 2017). Sexting is a complex issue, as it can be consensual or non-consensual. Reasons for sexting vary and include flirting, relationship building, or sexual self-exploitation, as well as coercion or extortion, intimidation and other abuse (SWGFL/UK Safer Internet Centre et al. 2017). The online sharing of intimate or sexual photos or videos without consent is image‑based abuse (eSafety Commissioner 2017).
Bullying can cause physical or psychological harm (Australian Education Authorities 2020). It can also have a wide range of negative long-term outcomes on both victims and perpetrators, which can be severe and persist into adulthood (United Nations Children’s Fund 2014). Research has found a relationship between bullying and depression, anxiety, suicidal ideation, low life satisfaction, greater risk of eating disorders, social and relationship difficulties and academic difficulties (United Nations Children’s Fund 2014).
Bullying as a public health concern has been recognised through its inclusion as a risk factor in the Global Burden of Disease 2017, and in the forthcoming Australian Burden of Disease study, due for release in 2021. Results from the Global Burden of Disease 2017 study showed that, for Australian young people aged 10–24, 12% of the total disability-adjusted life years (DALYs) for anxiety disorders, and 9.7% of total DALYs for depressive disorders were attributable to bullying victimisation (Stanaway et al. 2018 in Jadambaa et al. 2019). (For information on DALYs see Technical notes).
High rates of bullying across late childhood and early adolescence have been found for both boys and girls, but with greater persistence among girls. This may be a contributing factor to emerging sex difference in depression and anxiety across early adolescence (Fujikawa et al. 2021).
Survey findings have also shown a strong relationship between experiencing bullying or experiencing negative online behaviours and being a perpetrator (Lawrence et al. 2015; eSafety Commissioner 2018a).
Box 1: Data sources on bullying and negative online behaviours
National data on bullying are available from a number of sources. However, differences in reference periods, age groups and definitions of bullying mean that they are not comparable. Experiences across a range of settings are currently limited and data are not available about bullying in the workplace.
In 2019–20 the Department of Education, Skills and Employment commissioned the Telethon Kids Institute (led by Professor Donna Cross) to undertake a literature review and develop a project plan as a first step to determining requirements for an updated Bullying Prevalence Study. The study would be a successor to the 2009 ![]()
![]()
![]()
![]() Covert Bullying Prevalence Study. Progression to stage two of this project is still under consideration.
Covert Bullying Prevalence Study. Progression to stage two of this project is still under consideration.
Data on bullying for this section are sourced from the annual Mission Australia Youth Survey, the second Australian Child and Adolescent Survey of Mental Health and Wellbeing (also known as, and hereafter referred to as the Young Minds Matter survey), and the Programme for International Student Assessment (PISA).
Mission Australia Youth Survey
The Mission Australia Youth Survey, is an opt-in survey that has been conducted annually since 2002. It asks young people aged 15–19 what concerns them; what they value; and their views of work, study and the future. In 2019, 25,100 young people took part, the majority doing so online (93%) and the rest (7.0%) on paper.
Young people were engaged via schools, community organisations, through Mission Australia services and at youth events.
In 2019, the survey included the question: ‘Have you experienced bullying in the past 12 months’? Respondents could select 1 or more from the following options:
- cyberbullying (for example, hurtful messages, pictures or comments)
- physical bullying (for example, hitting, punching)
- social bullying (for example, rumours, being embarrassed or excluded)
- verbal bullying (for example, name calling, teasing)
- other (please specify) (Mission Australia Youth Survey questionnaire, 2019)
These data do not differentiate between repeated and one-off bullying.
Young Minds Matter survey
The Young Minds Matter survey is a household survey of young people aged 4 to 17 conducted in 2013–14 by the Telethon Kids Institute at the University of Western Australia, in partnership with Roy Morgan Research. The survey collected data from randomly sampled families across Australia except in Very remote areas. A total of 6,310 parents and carers, and 2,967 young people aged 11–17 responded.
The survey was designed to provide information about the mental health and wellbeing of Australian children and adolescents, and their use of health and educational services to obtain help. Data were collected on bullying that occurred during the 12 months before the survey and included frequency of bullying. Reported data differentiate between bullying that occurred over 12 months before the survey, every few months or less often, and every few weeks or more often (Lawrence et al. 2015).
Programme for International Student Assessment
Data on international comparisons of bullying are sourced from the Programme for International Student Assessment (PISA). PISA is a triennial survey of 15 year old students around the world.
It focuses on the core school subjects of science, reading and mathematics. Additional questionnaires are provided to students to gather contextual information, such as on their socioeconomic background and their attitudes towards school (such as sense of belonging).
PISA measures 3 types of bullying: physical, relational (also known as social) and verbal. Statements that students were asked to respond to include:
- Other students left me out of things on purpose (relational bullying)
- Other students made fun of me (verbal bullying)
- I was threatened by other students (verbal/physical bullying)
- Other students took away or destroyed things that belong to me (physical bullying)
- I got hit or pushed around by other students (physical bullying)
- Other students spread nasty rumours about me (relational bullying).
These statements are combined into a single indicator, ‘any type of bullying act’.
Reported data differentiate between bullying that occurred over 12 months before PISA testing, based on the following categories: Never or almost never, A few times a year, A few times a month, Once a week or more.
Digital lives of Aussie teens
Data on negative online behaviours are sourced from the eSafety Commissioner’s report Digital lives of Aussie teens. The data are based on an omnibus survey undertaken by Omnipoll, using the non-probability-based Lightspeed consumer panel. Survey data were collected between 17 and 28 September 2020, with 627 in‑scope teenagers responding via mobile phone.
Negative online behaviours are defined as:
- being contacted by a stranger
- being sent inappropriate content
- being deliberately excluded from events/social groups
- suffering damage to reputation
- receiving online threats or abuse
- having online personal information/photos misused in a mean way
- having other negative experiences.
Youth Digital Participation Survey 2017
Data on sexting are from the eSafety Commissioner’s Youth Digital Participation Survey 2017. The survey comprised a random sample of more than 3,000 young Australians aged 8–17; these young people were asked about their experiences and behaviours related to safety online in the 12 months to June 2017.
Data in this section are sourced from the report Young people and sexting: attitudes and behaviours, supplemented with unpublished data.
Sexting behaviours reported in the survey relate to the transmission of (nearly) nude images or videos such as:
- sending one
- being asked for one
- asking others for one
- sharing one of someone else
- receiving an unsolicited one.
How many young people experience bullying?
The Mission Australia Youth Survey 2019 included, for the first time, a question on whether survey respondents have experienced bullying in the past 12 months (see Box 1). In 2019, among survey respondents aged 15–19:
- just over 1 in 5 (21%) reported that they had experienced bullying in the past 12 months
- the proportion was slightly higher among females than males (22% and 19%).
The survey collected data on 4 main types of bullying: verbal, social, cyber and physical (see Box 1).
- The most common type of bullying experienced in the 12 months before the survey was verbal (71%), followed by social (61%) and cyberbullying (37%). Physical bullying was the least common of the 4 types (22%).
- Social bullying or cyberbullying were more common among females (68% and 40%, respectively) than males (50% and 30%, respectively) (Figure 1).
- Physical bullying was more common among males than females (30% and 15%).
Note that respondents could choose multiple forms of bullying in the survey questionnaire.
Figure 1: Type of bullying experienced in the previous 12 months by 15–19 year olds, by sex, 2019
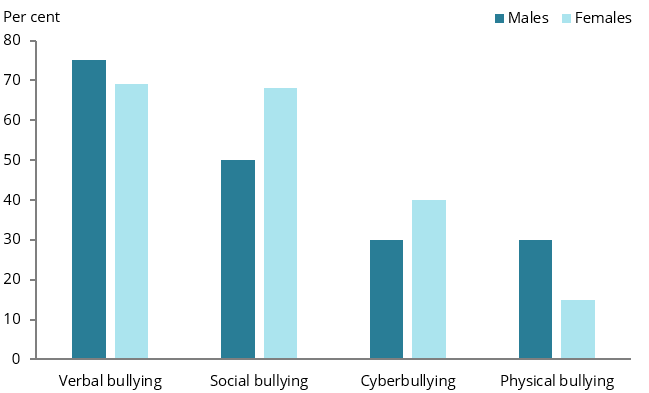
Chart: AIHW.
Source: Carlisle et al. 2019a.
Based on the Young Minds Matter survey, in 2013–14, among young people aged 16–17, more than 1 in 4 (28%) had been bullied in the previous 12 months:
- 1 in 4 (21%) had been bullied every few months or less often
- 7.1% had been bullied every few weeks or more often (Lawrence et al. 2015).
Differences between the methodologies and age ranges in scope of the Young Minds Matter survey and the Mission Australia Youth Survey are likely to account for differences in rates of bullying (see Box 1).
Where do young people experience bullying?
Based on the Mission Australia Youth Survey, of those who had experienced bullying in the 12 months before the survey:
- 4 in 5 (80%) reported that the bullying took place at school/TAFE/university, with similar proportions for males (82%) and females (79%)
- 1 in 3 (34%) reported they had experienced bullying online/on social media. The proportion was higher among females (37%) than males (27%).
What helped young people to deal with bullying?
Young people used a range of methods to deal with bullying:
- almost half (46%) ignored it
- more than 1 in 3 (37%) removed themselves from the situation
- just over 1 in 3 (34%) talked to close friends or family
- 1 in 3 (33%) distracted themselves through other activities
- 1 in 5 (20%) confronted the bully/ies
- 18% talked to a support person.
For 13% of young people, nothing helped to deal with the bullying.
A higher proportion of females than males reported that talking to close friends or family helped (42% and 24%).
A higher proportion of males reported that confronting the bully/ies helped them to deal with bullying (24% compared with 18% of females).
Are some young people bullied more than others?
Based on data from the Mission Australia Youth Survey, in 2019, among young people aged 15–19 who experienced bullying in the previous 12 months, the proportion was:
- twice as high among those with disability compared with those without disability (43% compared with 19%) (Hall et al. 2020) (Figure 2)
- higher among those living in regional areas than among those living in major cities (25% compared with 19%) (Carlisle et al. 2019b).
Figure 2: Bullying experienced in the previous 12 months by 15–19 year olds, by population group, 2019
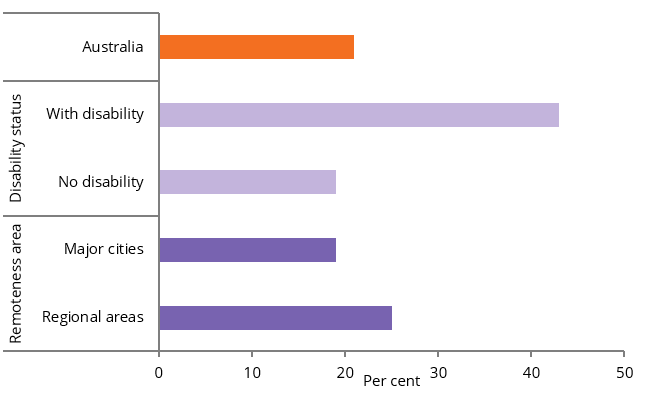
Chart: AIHW.
Source: Carlisle et al. 2019a, 2019b, Hall et al. 2020.
Based on self-reported data from the Young Minds Matter survey, in 2013–14, the proportion of young people aged 16–17 with a major depressive disorder who were bullied:
- in the previous 12 months was 2.5 times as high as for those with no mental disorder (56% compared with 22%)
- every few weeks or more often was 5.5 times as high as for those with no mental disorder (22% compared with 4.1%).
The proportion of those young people who felt either ‘a lot’ or ‘extremely’ upset as a result of bullying in the previous 12 months was 5 times as high for those with major depressive disorders (31%) as for those with no disorder (6.2%). However, it is not possible to determine if the depression was caused by or contributed to the bullying (Lawrence et al. 2015).
Cyberbullying and negative online experiences
Based on the eSafety Commissioner’s report The digital lives of Aussie teens (see Box 1 for survey methodology), in the 6 months prior to September 2020 among young people aged 12–17:
- 4 in 10 (44%) had at least 1 negative online experience
- negative online experiences were more common among girls than boys (47% and 41%)
- negative online experiences were more common among 14–17 year olds than among 12–13 year olds (51% and 32%).
The top 3 negative experiences for young people aged 12–17 were:
- being contacted by a stranger or someone they did not know (30%)
- being sent unwanted inappropriate content, such as pornography or violent content (20%)
- being deliberately excluded from events/social groups (16%) (eSafety Commissioner 2021).
Girls were more likely than boys to be contacted by a stranger or someone they did not know (35% and 26%). Boys were slightly more likely than girls to receive online threats or abuse (18% compared with 11%) (eSafety Commissioner 2021).
In 2020, more than 80% of young people took some form of action after a negative online experience. While a full comparison cannot be made with data from the 2017 Youth Digital Participation Survey, some comparisons are possible.
Among young people aged 12–17:
- 54% blocked the person responsible for their negative online experience (compared with 43% in 2017)
- 43% spoke to family/friends about it (compared with 64% in 2017)
- 36% unfriended the offending person (no comparative data from 2017)
- overall, 4 in 10 formally reported their experience:
- 21% to the social media company (compared with 13% in 2017)
- 21% to their school
- 10% to someone else.
As multiple formal networks could be reported, individual proportions do not sum to the total formally reporting their experiences.
The data indicate a possible shift between 2017 and 2020 in how young people deal with negative online experiences – from informal approaches, such as talking to family and friends to more self-help (for example, blocking, unfriending) and formal reporting (eSafety Commissioner 2021).
Young people are also acting to build a safer and more inclusive online environment, with most (89%) reporting that they have done at least 1 positive thing online:
- 75% had posted positive/nice comments about others
- 71% had supported or listened to a friend who had had a bad experience
- 70% made sure that peers were not excluded online (eSafety Commissioner 2021).
How many young people have experience with sexting?
The e-Safety Commissioner’s 2017 Youth Digital Participation Survey collected data on a range of sexting behaviours (see Box 1).
Among young people aged 14–17 in the 12 months to June 2017:
- around 1 in 3 had some experience with sexting (either consensual or non‑consensual)
- the most common forms of sexting were being asked for a (nearly) nude image or video of themselves or receiving an unsolicited (nearly) nude image or video of someone (15%)
- around 5% of young people said they have sent a (nearly) nude image or video of themselves to someone else
- around 5% of all young people either shared an image of someone else online or had shown it to others on their device during the 12 months to June 2017
- 3% of respondents reported that they had asked for a nude or nearly nude image or video (SWGFL/UK Safer Internet Centre et al. 2017).
Overall, sexting behaviour was more common among females (35%) than males (22%) (SWGFL/UK Safer Internet Centre et al.2017). In relation to specific sexting behaviours, being asked for a (nearly) nude image or video of themselves, receiving an unsolicited (nearly) nude image or video or sending a (nearly) nude image or video of themselves were more common among females than males (Figure 3).
Figure 3: Sexting behaviours experienced in the previous 12 months by 14–17 year olds, by sex, 2017
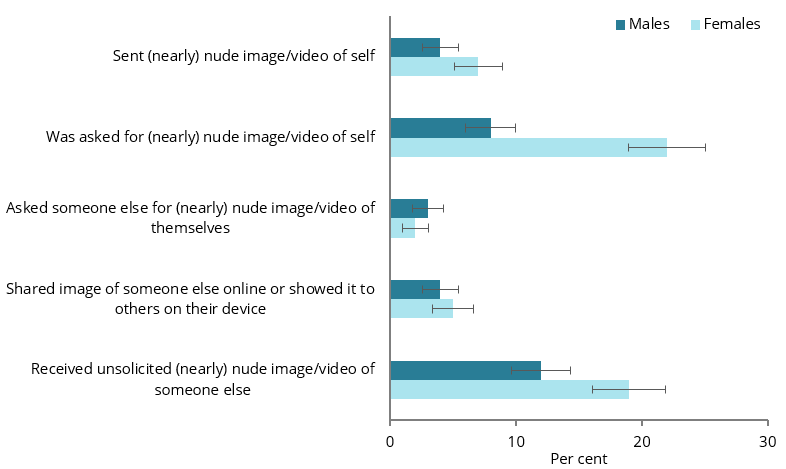
Chart: AIHW.
Source: eSafety Commissioner, unpublished data.
Among young people aged 14–17 who received requests for a (nearly) nude image or video of themselves:
- over half (52%) received a request from someone they knew. This was more common among females (54%) than males (36%) (SWGFL/UK Safer Internet Centre et al. 2017)
- 1 in 3 young people received a request from either friends (33%) or boyfriends/girlfriends (31%) (SWGFL/UK Safer Internet Centre et al. 2017)
- 5% of young people had received a request from someone else (eSafety Commissioner, unpublished data).
What actions did young people take in response to unwanted (nearly) nude images or videos?
Nearly three-quarters of young people who received unwanted nude or nearly nude images or videos took at least 1 action:
- almost half (49%) blocked the sender’s account; this response was more common among females than males (64% and 27%)
- almost 1 in 3 (31%) told their friends
- almost 1 in 5 (19%) communicated or wrote something to the person who sent the images or videos (not face to face)
- 17% told their parents
- 13% reported what happened to the website or social media company (eSafety Commissioner, unpublished data).
Close to 1 in 4 (23%) took no action. It was more common for males to take no action than females (33% and 16%) (eSafety Commissioner, unpublished data).
How do young people feel about sexting?
In 2017:
- more than half (58%) of young people felt uncomfortable about sexting while 2 in 5 (43%) felt disgusted about being asked for nearly (nude) images or video. The proportion of females who felt disgusted was higher than that for males (47% and 32%)
- over 1 in 4 (26%) young people felt pressured or nervous, while over 1 in 5 felt mad/angry (21%)
- a minority either felt flattered (18%) or excited (10%) (eSafety Commissioner, unpublished data).
What are young people’s general attitudes towards sexting?
In 2017:
- almost three-quarters (74%) disagreed with the statement that sexting is not a problem
- 7 in 10 (70%) agreed that spreading a nude picture or video of someone without their consent was illegal and that people should not do it
- almost 1 in 3 (32%) agreed that adults overreact about this sort of thing, with the proportion slightly higher among males than females (34% and 29%)
- over 1 in 4 (28%) agreed that it was someone’s own fault if their images were shared without consent (eSafety Commissioner, unpublished data).
Are negative online experiences and sexting the same for everyone?
In 2017, negative online experiences and sexting behaviour varied depending on disability status and, to some degree, birthplace. Among 13–17 year olds:
- a higher proportion of young people with disability experienced most types of negative online experience than those without disability (Figure 4). The greatest differences were for unwanted contact and content, and threats and abuse.
- the proportion of overseas-born young people who experienced threats and abuse was lower than that for Australian-born young people (20% compared with 27%) (eSafety Commissioner 2018a, unpublished data).
Figure 4: Negative online experiences among 13–17 year olds, by disability status, 2017
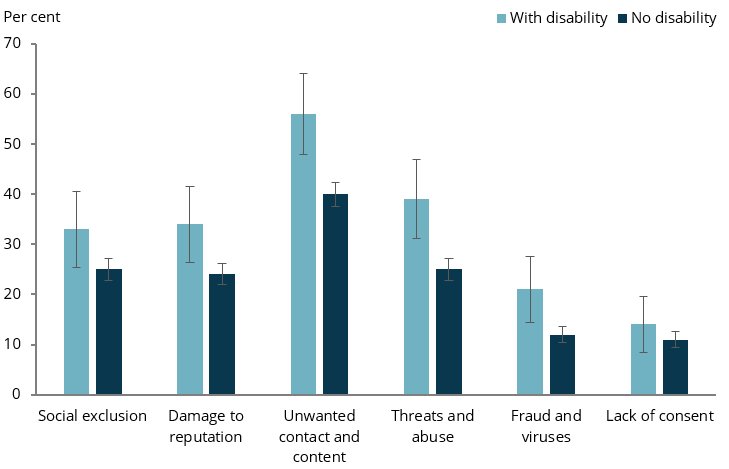
Chart: AIHW.
Source: eSafety Commissioner, 2018a, unpublished data.
- A higher proportion of young people with disability sent a (nearly) nude image or video of themselves than did young people without disability (11% compared with 5%). Note these results should be treated with some caution as the relative standard error for the young people with disability was relatively high (26%).
How does Australia compare internationally on bullying?
Based on data from the PISA 2018, the proportion of Australian students aged 15 who were bullied (any act of bullying) at least a few times a month was higher than the OECD average (30% compared with 23%) (Figure 5).
Figure 5: Bullying among 15 year olds across selected OECD countries, 2018
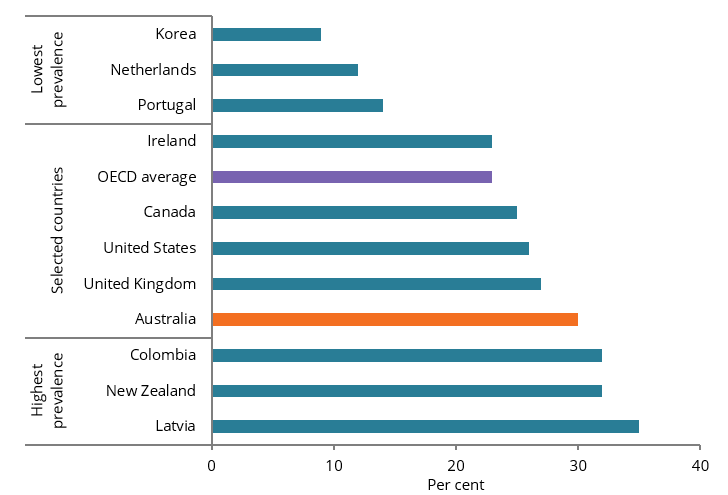
Chart: AIHW.
Source: OECD 2019.
Where do I find more information?
For information on topics related to young people and relationships, see:
For more information on Indigenous young people and being treated unfairly, see:
- Section 5.7, Being treated unfairly in Aboriginal and Torres Strait Islander adolescent and youth health and wellbeing 2018
For information on children and bullying, see:
For more information on youth and bullying, see:
- Youth Survey Report 2019
- Youth Survey Report 2019: Comparing major cities and regional areas
- Young willing and able: Youth Survey Disability Report 2019.
For more information on youth mental health and bullying, see:
- The mental health of children and adolescents. Report on the second Australian Child and Adolescent Survey of Mental Health and Wellbeing (also known as Young Minds Matter).
For more information on negative online behaviours and sexting, see: