Australia's youth:
Secondary school education
Web article
Last updated:
Topic: Children & youth
Part of Australia's youth
Citation
AIHW
Australian Institute of Health and Welfare (2021) Secondary school education, AIHW, Australian Government, accessed 20 April 2024.
APA
Australian Institute of Health and Welfare. (2021). Secondary school education. Retrieved from https://pp.aihw.gov.au/reports/children-youth/secondary-education
MLA
Secondary school education. Australian Institute of Health and Welfare, 25 June 2021, https://pp.aihw.gov.au/reports/children-youth/secondary-education
Vancouver
Australian Institute of Health and Welfare. Secondary school education [Internet]. Canberra: Australian Institute of Health and Welfare, 2021 [cited 2024 Apr. 20]. Available from: https://pp.aihw.gov.au/reports/children-youth/secondary-education
Harvard
Australian Institute of Health and Welfare (AIHW) 2021, Secondary school education, viewed 20 April 2024, https://pp.aihw.gov.au/reports/children-youth/secondary-education
Key findings
- In 2019, 65% of Year 9 students attended school on at least 90% of the total possible school days.
- Between 2008 and 2019, the proportion of Year 9 students who achieved at or above the national minimum standard for numeracy increased over time (94% to 96%) and for reading remained stable (varying between 91% and 93%).
- In 2018, Australian high school students’ sense of belonging at school was below the OECD average.
Secondary school education is a crucial part of young people’s lives. Their experiences and achievements at school have lasting effects on their health and wellbeing as well as their future productivity and contribution to society.
The Organisation for Economic Co-operation and Development (OECD) sees a student’s reading and numeracy as fundamental to their educational achievement. These abilities, in turn, not only help students to engage with society but also affect their future employment prospects (OECD 2016).
School attendance contributes importantly to a student’s academic achievement and affects further education and future employment opportunities (SCRGSP 2020). It is also a measure of a student’s behavioural engagement with school.
A student’s attendance pattern is set down in the first years of school. Non‑attendance leads to poorer academic achievement, with the effects of absences accumulating over time (Hancock et al. 2013). Non-attendance is also associated with negative social outcomes, such as social isolation and emotional and behavioural difficulties (AITSL 2019).
A student’s sense of belonging relates to how connected, respected and supported students feel at school. A greater sense of belonging is associated with higher academic motivation, achievement and self-esteem (OECD 2019a). Sense of belonging is also a measure of a student’s emotional engagement with school (SCRGSP 2020).
Sense of belonging is, however, only one aspect of student wellbeing. The Australian Student Wellbeing Framework is a national framework for student wellbeing that addresses many aspects of wellbeing and outlines an overarching vision, principles and practices to improve and maintain safety, wellbeing and positive relationships within the school community (Education Services Australia 2020).
For data on young people who attained Year 12 (or equivalent) or Certificate III (or above) see Non-school qualifications.
Box 1: Data sources and national performance measures
Data reported in this section focus on national measures relating to secondary school students.
On 1 January 2019, the National School Reform Agreement (NSRA) replaced the National Education Agreement (NEA) and the National Education Reform Agreement (NERA).The NSRA is a joint agreement between the Australian, state and territory governments to lift student outcomes across Australian schools (COAG 2019). It sets out 8 reforms to be implemented nationally over the next 5 years, along with national targets and measures. For more information, see The National School Reform Agreement.
Measures on school attendance and literacy and numeracy from the NSRA are presented in this section. To provide a longer time series on these topics, data for measures under the former NEA and NERA agreements are also included.
School attendance data
School attendance data are sourced from the Australian Curriculum, Assessment and Reporting Authority (ACARA) National Student Attendance Data Collection. ACARA, on behalf of the Education Council, developed the National Standards for Student Attendance Data Reporting (national standards) to standardise reporting across Australia for comparability purposes.
Student attendance rates were also a measure under the NEA and the NERA. As national time-series data are available for years 2014 to 2019, attendance rate data are also included in this section. Student attendance rates refer to the number of days of school attended as a percentage of the total number of possible school days.
Student attendance levels refer to the proportion of students whose attendance rate in Semester 1 is equal to or greater than 90% (referred to in this section as ‘at least 90%’) (see Glossary in Australia’s welfare 2019). Student attendance levels are a measure under the NSRA. National data on student attendance levels have been collected only from 2018.
National Assessment Program – Literacy and Numeracy (NAPLAN)
NAPLAN tests have been conducted annually for all students across Australia in years 3, 5, 7 and 9 since 2008. They yield nationally comparable data. NAPLAN data includes those on reading, writing, spelling, language conventions (grammar and punctuation) and numeracy. This section focuses on Year 9 reading and numeracy only.
Reading and numeracy data in this section are expressed in terms of:
- the mean score of students (a previous measure in the NEA and the NERA)
- the percentage of students who achieved at or above the national minimum standard (also a previous measure in the NEA and the NERA)
- the proportion of students in the top and bottom levels of performance (that is, the top 2 and bottom 2 bands for Year 9 students (a measure in the NSRA)).
NAPLAN mean scores generally range from 0–1,000 points, with higher scores indicating better performance; the scores are equated so that a score of 700 in reading has the same meaning in 2008 as in 2019 (ACARA 2019a).
NAPLAN and COVID-19
NAPLAN tests were cancelled for 2020 due to the COVID-19 pandemic but are expected to restart in 2021 (ACARA 2020).
Programme for International Student Assessment
The Programme for International Student Assessment (PISA) is a triennial survey of 15-year-old students around the world (see Technical notes). It focuses on the core school subjects of science, reading and mathematics. Additional questionnaires are provided to students to gather contextual information, such as socioeconomic background, and attitudes towards school (for example, a sense of belonging). This section focuses on the core school subjects of reading and mathematics.
How many young people attend school?
Attendance level is a measure of the proportion of students that attended school on at least 90% of the total possible school days. In 2019, the attendance level of Year 9 students was 65%.
The attendance levels were:
- similar among males (65%) and females (66%)
- higher for non-government schools (73%) than government schools (60%) (ACARA 2019b).
Has school attendance changed over time?
Between 2018 and 2019:
- the attendance level for Year 9 students decreased slightly
- independent schools had the highest attendance levels, followed by Catholic schools and then government schools
- the difference in attendance level between independent schools and government schools was the greatest in 2019 (16 percentage points) (Figure 1).
As student attendance rate has been recorded for longer than attendance level and it was a measure under the former NEA and NERA agreements.
Between 2014 and 2019:
- the student attendance rate for Year 9 students remained steady (between 89–91%)
- independent schools had a consistent pattern of having the highest attendance rates, followed by Catholic schools and then government schools
- the difference in attendance rate between independent schools and government schools was the greatest in 2019 (5 percentage points) (ACARA 2019b).
Figure 1: Year 9 student attendance levels, by school sector, 2018–2019
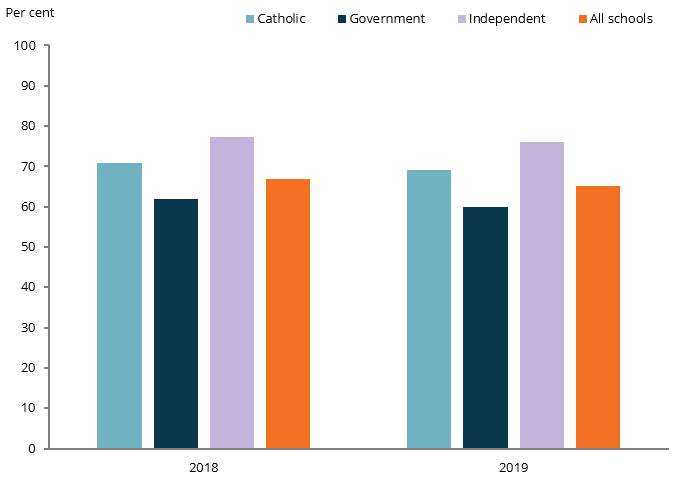
Chart: AIHW.
Source: ACARA 2019b.
Are attendance levels the same for everyone?
In 2019, based on data from the ACARA National Student Attendance Data Collection, Year 9 student attendance levels were higher in Major cities (68%) than in Inner regional (60%), Outer regional (58%), Remote (46%) and Very remote (22%) areas (ACARA 2019b).
Attendance data for students from a low socio-educational advantage background or for students with disability are not currently available in this Collection.
How have Year 9 students performed on reading and numeracy tests?
In 2019, based on NAPLAN data, among students in Year 9, the:
- reading mean score was 581.3 (574.1 for males and 588.8 for females)
- proportion that achieved at or above the minimum standards for reading was 92% (94% for females and 89% for males)
- proportion in the top 2 bands for reading was 21% (with 22% in the bottom 2 bands)
- numeracy mean score was 592.1 (597.0 for males and 587.0 for females)
- proportion who achieved at or above the minimum standards for numeracy was 96% (97% for females and 96% for males)
- proportion in the top 2 bands for numeracy was 24% (with 18% in the bottom 2 bands) (ACARA 2019c; Productivity Commission 2020).
Have reading and numeracy outcomes changed over time?
Between 2008 and 2019, among Year 9 students, the:
- reading mean score remained relatively stable over time (578.0 in 2008 and 581.3 in 2019) (Figure 2)
- proportion who achieved at or above the national minimum standard for reading also remained stable at 91–93% (ranging between 89% and 92% for males, and between 93% and 95% for females) (ACARA 2019c)
- numeracy score remained relatively stable over time (582.2 in 2008 and 592.1 in 2019) (Figure 2)
- proportion who achieved at or above the national minimum standard for numeracy increased (94% to 96%) (this was true for both males (94% to 96%) and females (94% to 97%)) (ACARA 2019c).
Figure 2: National mean scores for Year 9 students, by sex, 2008 to 2019
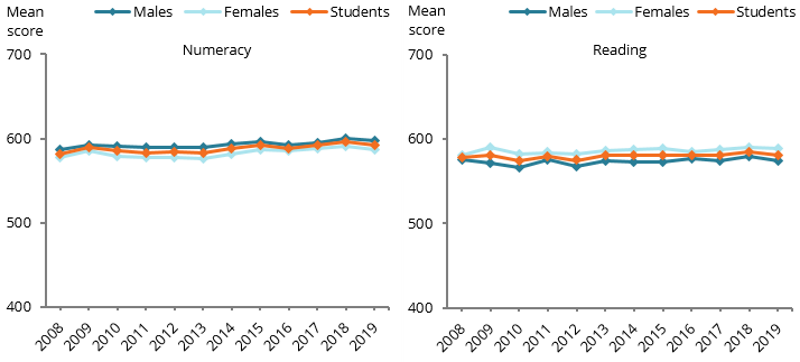
Chart: AIHW.
Source: ACARA 2019c.
Are reading and numeracy outcomes the same for everyone?
In 2019, based on NAPLAN data, the mean reading score for Year 9 students varied between population groups. The mean reading score was:
- similar for students from a language background other than English (LBOTE) and their non-LBOTE counterparts
- higher for students in Major cities than in Inner regional, Outer regional, Remote and Very remote areas
- higher for students whose parents hold a bachelor degree or higher than for students whose parents hold a diploma, certificate, Year 12 or equivalent, Year 11 or equivalent, or below
- higher for students with parents in Occupation Group 1, which includes senior managers and qualified professionals, than for parents in occupation groups 2, 3 or 4 or for parents not in paid work (Figure 3).
Figure 3: National mean scores for reading for Year 9 students, by selected population groups, 2019
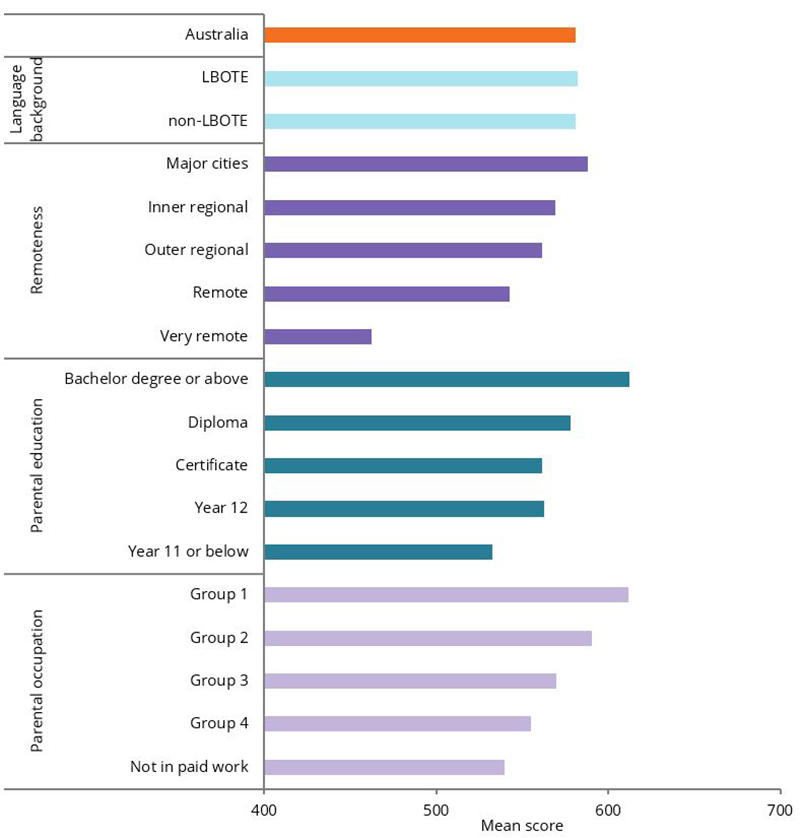
Note: Group 1: Senior management and qualified professionals; Group 2: Other business managers and associated professionals; Group 3: Tradespeople, clerks, skilled office people, sales and service staff; Group 4: Machine operators, hospitality staff, assistants, labourers; Not in paid work: Not in paid work in the previous 12 months.
Chart: AIHW.
Source: ACARA 2019c.
The mean numeracy score for Year 9 students also varied between population groups. The numeracy score was:
- higher for students from a language background other than English (LBOTE) than for their non-LBOTE counterparts
- higher for students in Major cities than in Inner regional, Outer regional, Remote and Very remote areas
- higher for students whose parents hold a bachelor degree or higher compared with students whose parents hold a diploma, certificate, Year 12 or equivalent, Year 11 or equivalent, or below
- higher for students with parents in Occupation Group 1, which includes senior managers and qualified professionals, than for parents in occupation groups 2, 3 and 4, and parents not in paid work (Figure 4).
Figure 4: National mean scores for numeracy for Year 9 students, by selected population groups, 2019
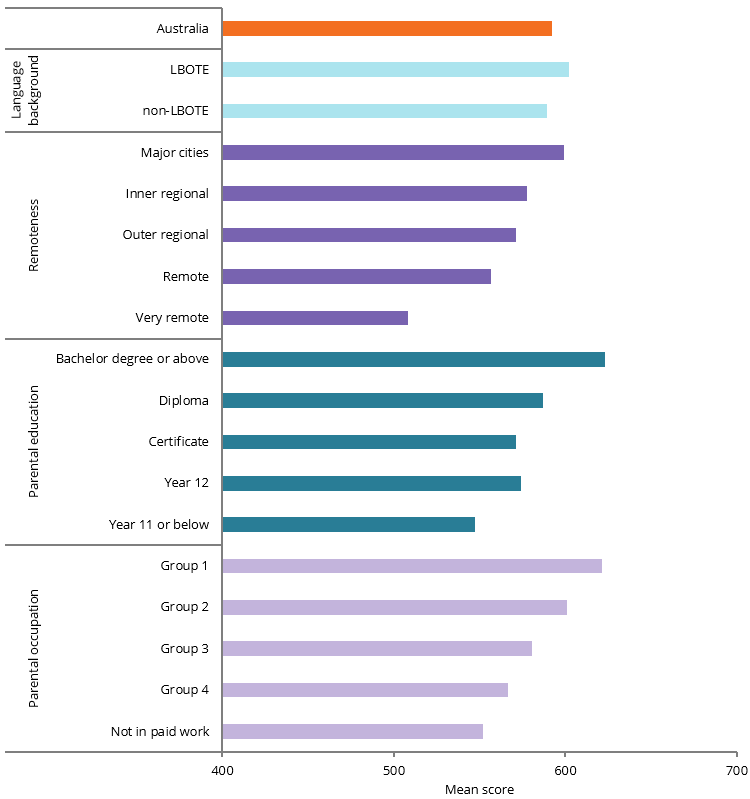
Note: Group 1: Senior management and qualified professionals; Group 2: Other business managers and associated professionals; Group 3: Tradespeople, clerks, skilled office people, sales and service staff; Group 4: Machine operators, hospitality staff, assistants, labourers; Not in paid work: Not in paid work in the previous 12 months.
Chart: AIHW.
Source: ACARA 2019c.
How does Australia compare internationally?
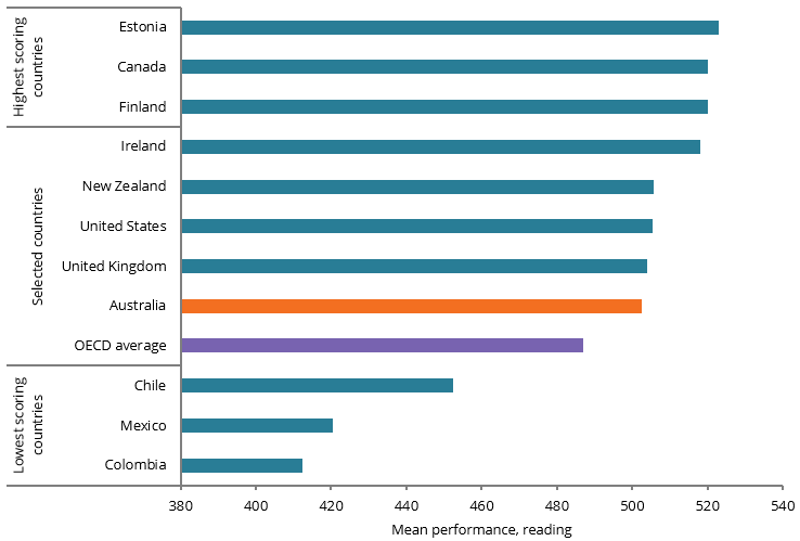
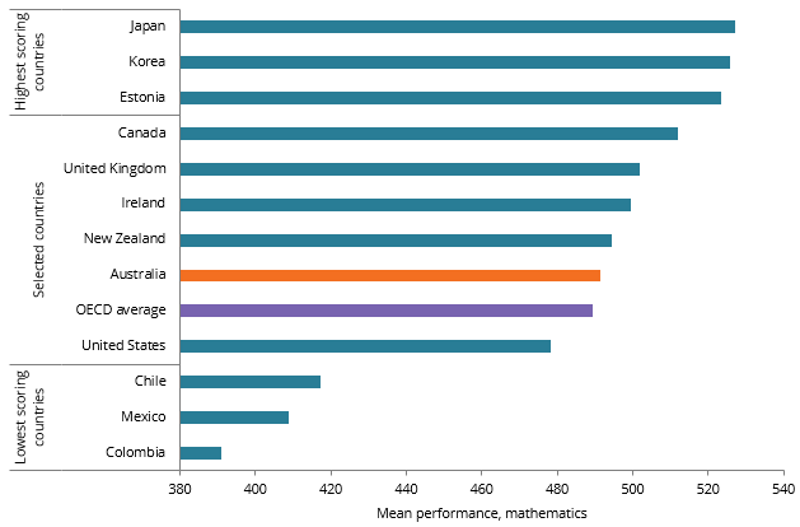
Based on data from PISA 2018, the mean performance of Australian students (aged 15, see Technical notes) was higher than the OECD average in reading (503 compared with 487) but similar to the OECD average in mathematics (OECD 2019b) (figures 5 and 6).
Of the 37 OECD countries that took part in PISA 2018, Australia outperformed 21 of them in reading and 11 in mathematics (OECD 2019b).
Of a select group of OECD countries, Australia performed similarly to:
- New Zealand, the United States and the United Kingdom in reading (Figure 5)
- New Zealand in mathematics (OECD 2019b) (Figure 6).
Since the first measurement of PISA (2000), the performance of Australian students has been declining across reading and mathematics (see Australia’s welfare 2019).
Figure 5: Reading mean performance, by selected OECD countries, 2018
Notes
- Only OECD countries are shown, with only main English-speaking countries selected for comparison. For a comparison of all OECD countries and PISA partner countries and economies, see OECD 2019b.
- PISA 2018 results for reading performance are reported as missing for Spain; see OECD 2019b.
Chart: AIHW.
Source: OECD 2019b.
Figure 6: Mathematics mean performance by selected OECD countries, 2018
Notes
- Only OECD countries are shown, with only main English-speaking countries selected for comparison. For a comparison of all OECD countries and PISA partner countries and economies, see OECD 2019b.
- PISA 2018 results for reading performance are reported as missing for Spain; see OECD 2019b.
Chart: AIHW.
Source: OECD 2019b.
Sense of belonging at school
Sense of belonging has been associated with social and academic outcomes, including higher academic motivation, self-esteem and achievement (OECD 2019a).
The PISA survey calculates a Sense of Belonging index, based on the responses to 6 statements used to measure sense of belonging and compare OECD countries. These 6 responses show that most students in Australia feel socially connected at school (tables 1 and 2).
|
Statements related to sense of belonging |
Australia |
OECD average |
|---|---|---|
|
I make friends easily at school |
76 |
75 |
|
I feel like I belong at school |
68 |
71 |
|
Other students seem to like me |
85 |
81 |
Note: The OECD average refers to the average across 36 OECD countries in PISA 2018 (not including Israel).
Source: OECD 2019a.
|
Statements related to sense of belonging |
Australia |
OECD average |
|---|---|---|
|
I feel like an outsider (or left out of things) at school |
73 |
80 |
|
I feel awkward and out of place in my school |
75 |
80 |
|
I feel lonely at school |
81 |
84 |
Note: The OECD average refers to the average across 36 OECD countries in PISA 2018 (not including Israel).
Source: OECD 2019a.
The index of sense of belonging has an average of 0 and standard deviation of 1 across OECD countries and is calculated using the responses to the 6 statements in tables 1 and 2. The sense of belonging index score for Australia is –0.19, lower than the OECD average (0) (SCRGSP 2020).
Australian students from metropolitan areas reported a greater sense of belonging (–0.16) than students from provincial (–0.28) and remote (–0.26) areas (SCRGSP 2020) (For more information, see Technical notes).
Australian students from the highest socioeconomic quartile reported a greater sense of belonging (–0.06) than students in the other 3 quartiles (–0.16, –0.22 and –0.32 in the third, second and lowest quartile, respectively) (SCRGSP 2020) (For more information, see Technical notes).
Where do I find more information?
For information on topics related to wellbeing in this report, see:
For information on Indigenous young people and literacy and numeracy, see:
- Section 2.04 of Aboriginal and Torres Strait Islander Health Performance Framework (HPF) report 2020 or Section 3.1, Education of Aboriginal and Torres Strait Islander adolescent and youth health and wellbeing 2018.
For information on literacy and numeracy levels among children aged 0–14, see:
- literacy and numeracy in Australia’s Children.
For more information on:
- state and territory school student engagement surveys, see:
- New South Wales: Tell Them From Me
- Victoria: About You – Student Health and Wellbeing Survey, Student Attitudes to School Survey.
- South Australia: The Wellbeing and Engagement Collection
- Tasmania: Student Wellbeing Survey
- Australian Capital Territory: The Australian School Climate and School Identification Measurement Tool
- state and territory frameworks and initiatives for student wellbeing, see:
- New South Wales: Wellbeing Framework for Schools
- Victoria: The Victorian Child and Adolescent Monitoring System Outcomes Framework
- Queensland: Student Learning and Wellbeing Framework
- Western Australia: The Wellbeing Monitoring Framework
- South Australia: Wellbeing for Learning and Life framework
- Tasmania: Tasmanian Child and Youth Wellbeing Framework and the 2018–2021 Child and Student Wellbeing Strategy: Safe, Well and Positive Learners
- Australian Capital Territory: Engaging Schools Framework
- Northern Territory: Framework for Inclusion 2019–2029.