Australia's youth:
Subjective wellbeing
Web article
Last updated:
Topic: Children & youth
Part of Australia's youth
Citation
AIHW
Australian Institute of Health and Welfare (2021) Subjective wellbeing, AIHW, Australian Government, accessed 17 April 2024.
APA
Australian Institute of Health and Welfare. (2021). Subjective wellbeing. Retrieved from https://pp.aihw.gov.au/reports/children-youth/subjective-wellbeing
MLA
Subjective wellbeing. Australian Institute of Health and Welfare, 25 June 2021, https://pp.aihw.gov.au/reports/children-youth/subjective-wellbeing
Vancouver
Australian Institute of Health and Welfare. Subjective wellbeing [Internet]. Canberra: Australian Institute of Health and Welfare, 2021 [cited 2024 Apr. 17]. Available from: https://pp.aihw.gov.au/reports/children-youth/subjective-wellbeing
Harvard
Australian Institute of Health and Welfare (AIHW) 2021, Subjective wellbeing, viewed 17 April 2024, https://pp.aihw.gov.au/reports/children-youth/subjective-wellbeing
Key findings
- In 2020, almost 3 in 5 (59%) young people aged 15–19 reported feeling happy or very happy with their life as a whole, similar to 2019 (61%).
- The proportion of males (66%) who reported feeling happy or very happy with their life as a whole was notably higher than for females (54%).
- In 2018, most young people aged 18 and 24 were very satisfied/fairly satisfied with their level of independence (85% and 89%, respectively).
- Around three-quarters of young people aged 18 and 24 were very satisfied/fairly satisfied with their career prospects (74% and 79%, respectively).
The Organisation for Economic Co-operation and Development (OECD) defines subjective wellbeing as good mental states and how people experience their lives (OECD 2020). Measuring subjective wellbeing is an important part of measuring quality of life, together with other social and economic dimensions (OECD 2013).
Subjective wellbeing is generally seen to comprise self-reported life evaluations, which involve a cognitive evaluation of the respondent’s life as a whole (or aspects of it) and measures of affect (that is, moods and emotions) (OECD 2013). Affect captures the feelings of the respondent at a particular point in time, which can be both positive (such as feelings of happiness) or negative.
Some researchers include a eudaimonic aspect (that is, that happiness is derived through meaningful experiences), reflecting an individual’s sense of purpose and engagement (OECD 2013). People who are resilient, know their own strengths and use them to achieve their goals have been reported to have higher wellbeing scores (APS 2016) (see also Box 3).
The Productivity Commission’s report, Mental Health, highlighted the importance of social and emotional wellbeing of children and young people. One of the reforms identified is to make the social and emotional development of school children a national priority. Several recommendations on how relevant national data could be improved are included (Productivity Commission 2020). For information on the sense of belonging at school, see Secondary school education.
Some data in this section cover the COVID-19 pandemic period. For more information on the overall impact of COVID-19 on young people, see COVID-19 and the impact on young people.
Box 1: Data sources on subjective wellbeing
Happiness
Data on the happiness of young people aged 15–19 are sourced from the Mission Australia Youth Survey reports, an opt-in survey which has been conducted annually since 2002. The survey asks young people aged 15–19 what concerns them; what they value; and their views of work, study and the future.
In 2020, 25,800 young people participated in the survey, (conducted between April and August 2020), with the majority doing so online (98%). The remaining 2% completed the survey on paper. Young people were engaged via schools, community organisations, through Mission Australia services and at youth events.
Life satisfaction
The Household, Income and Labour Dynamics in Australia (HILDA) survey is a nationally representative longitudinal household study that began in 2001. It follows the lives of more than 17,000 Australians each year and will do so for the course of their life. The survey collects information on many aspects of life in Australia, including household and family relationships, income and employment, and health and education. The same households and individuals are interviewed every year to see how their lives are changing over time. The survey follows not only the initial sample members for the remainder of their lives, but also their children and all subsequent descendants.
The Longitudinal Surveys of Australian Youth (LSAY), which began in 1995, follow young Australians over 10 years as they move through school to further study, work and beyond. Survey participants enter the study when they are aged about 15 and are then contacted once a year until they turn 25.
Nationally representative samples of over 10,000 young people start out in each cohort. Since 2003, participants have been recruited from Australian schools that take part in the Programme for International Student Assessment (PISA). Information collected includes student achievement and aspirations, attitudes to school, social background, vocational and further education, employment and job seeking, and satisfaction with various aspects of life.
Groups of survey participants are known as a ‘cohort’. Cohorts Y09 (who were aged 24 in 2018) and Y15 (who were aged 18 in 2018) are included in this report.
Variation across population groups
While the data collections HILDA and LSAY include variables to support the disaggregation of data by remoteness and socioeconomic areas, in many cases findings were not statistically significant, and so are not reported here. This may be due in part to small sample sizes.
How happy are young people?
In 2020, based on data from the Mission Australia Youth Survey collected between April and August 2020 among young people aged 15–19:
- the majority (around 59%) reported that they felt happy/very happy with their life as a whole, with the proportion notably higher among males (66%) than females (54%)
- more than half (56%) felt either very positive (12%) or positive (43%) about the future, with the proportion feeling very positive/positive – again, the proportion was higher among males (61%) than females (53%) (Tiller et al. 2020).
Between 2012 and 2020, the proportion of young people aged 15–19 who felt happy/very happy with their life as a whole ranged from 71% in 2012 to 59% in 2020 (Figure 1).
Figure 1: Level of happiness with their life as a whole among young people aged 15–19, 2012 to 2020
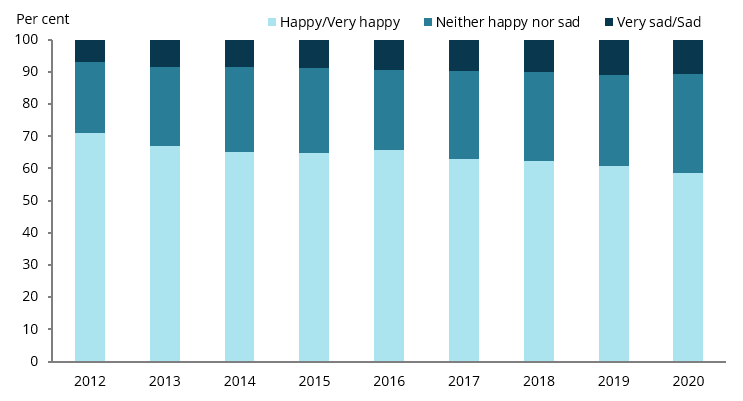
Chart: AIHW.
Source: Mission Australia National Youth Survey reports, 2012 to 2020
Based on a comparison of 2019 and 2020 survey results, the proportion of young people who reported feeling happy/very happy with their life as a whole was very similar in 2020 and 2019 (59% and 61%, respectively). The drop between these 2 years was 3 percentage points for females and 1 percentage point for males) (Carlisle et al. 2019; Tiller et al. 2020).
Between 2012 and 2020, the proportion of young people aged 15–19 who felt either very positive or positive about their future has fallen from 71% (in 2012) and 56% in 2020 (see Figure 2).
Figure 2: Feelings about the future among young people aged 15–19, 2012 to 2020
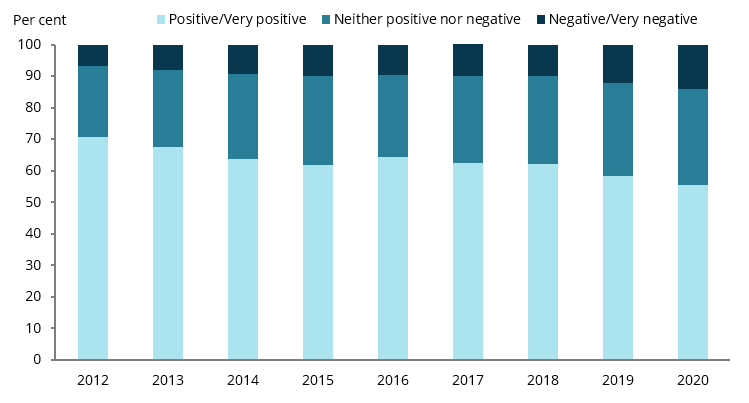
Chart: AIHW.
Source: Mission Australia National Youth Survey reports, 2012 to 2020
The proportion of young people who felt either very positive or positive about their future was similar in 2020 and 2019 (56% and 58%, respectively). The decrease was again greater for females (4 percentage points) than males (1 percentage point) (Carlisle et al. 2019; Tiller et al. 2020).
For the first time, in 2020, survey respondents were asked to report how much of the time they felt stressed in the 4 weeks before the survey:
- 2 in 5 young people (43%) reported that they felt stressed either all of the time or most of the time
- the proportion of females who reported feeling stressed either all of the time or most of the time was twice as high as that for males (54% compared with 27%) (Tiller et al. 2020).
Box 2: Emotional wellbeing of South Australia school students
A range of measures on emotional wellbeing are included in the Wellbeing and Engagement Collection, which includes survey data from South Australian students in years 4 to 12.
Results from the 2020 Collection, conducted in Term 3 among 38,400 students showed that, across years 7 to 12, most reported high or medium levels of wellbeing on a number of measures. The proportion reporting high or medium levels of wellbeing in relation to:
- happiness decreased from 87% in Year 7 to 81% in Year 11, with a slight increase in Year 12 (83%)
- optimism fell from 81% in Year 7 to 78% in Year 9 and increased to 82% in Year 12
- satisfaction with life dropped from 75% in Year 7 to 70% in Year 10, remaining similar in Years 11 and 12 (69% and 70% respectively)
The measure ‘High levels of worries and sadness’ was consistently higher for females than males across all year levels, from Year 7 to Year 12:
- ‘High levels of worries’ increased by 7 percentage points among girls, from 35% in Year 7 to 42% in Year 12, and by 3 percentage points for boys, from 20% to 23%.
- ‘High levels of sadness’ among girls ranged from 24% in Year 7 to 31% in Year 10, and among boys from 12% in Year 8 to 18% in Year 11 (SA Department for Education 2021). See also COVID-19 and the impact on young people for comparisons with data for 2019.
How satisfied are young people with their lives as a whole?
In 2018, the HILDA survey asked participants to score a response to the question ’How satisfied are you with your life as a whole?’, with 0 being completely dissatisfied and 10 completely satisfied. Among young people aged 15–24, overall, the average satisfaction score was 8.1. Between 2008 and 2018, the score remained stable at between 8.0 and 8.1.
Compared with other age groups, young people (aged 15–24) have reported the second-highest mean life satisfaction since 2003. Mean life satisfaction was highest for the 65 and over group (Wilkens et al. 2020).
The LSAY also asks questions about how satisfied young people are with their lives as a whole, as well as with different aspects of their lives. In 2018, data from the Y15 and Y09 cohorts (aged 18 and 24, respectively) revealed that a higher proportion of cohort Y09 (aged 24) than cohort Y15 (aged 18) were very or fairly satisfied with their life as a whole (90% and 84%, respectively). (For details regarding the LSAY scale, see Technical notes).
How satisfied are young people with different aspects of their lives?
The future, independence and career prospects
A high proportion of young people in both LSAY cohorts were very or fairly satisfied with their level of independence (that is, being able to do what you want):
- The proportion for cohort Y09 (aged 24) was a little higher than for cohort Y15 (aged 18) (89% and 85%, respectively) (Figure 3).
Results for being very or fairly satisfied with their future were both a little lower than those for independence for both cohorts, and differed:
- The proportion for cohort Y09 (aged 24) was higher than for cohort Y15 (aged 18) (85% and 77%, respectively).
Results for being very or fairly satisfied with career prospects was rated the lowest of these 3 aspects of life for both cohorts:
- The proportion for cohort Y09 (aged 24) was a little higher than for cohort Y15 (aged 18) (79% and 74%, respectively).
Figure 3: Satisfaction with independence, the future and career prospects, by LSAY cohort, 2018
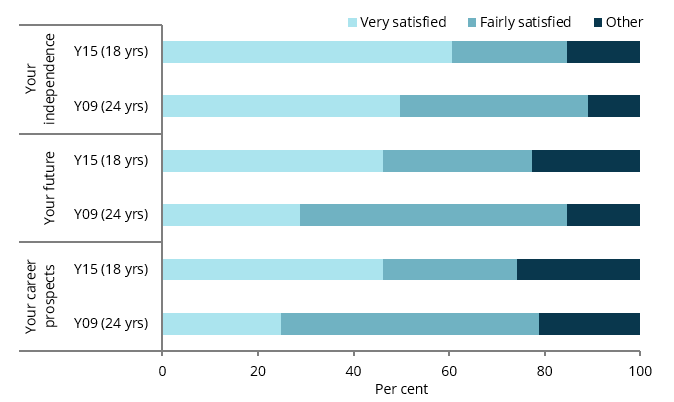
Note: The category ‘Other’ includes neither satisfied nor dissatisfied, fairly dissatisfied, very dissatisfied and don’t know (see Technical notes regarding scale).
Chart: AIHW.
Source: Longitudinal Surveys of Australian Youth, 2015 cohort (version 3.0); 2009 cohort (version 9.0).
Social contact
A high proportion of young people in both cohorts were satisfied with how they got on with people in general and their life at home:
- 89% of cohort Y09 (aged 24) and 87% of cohort Y15 (aged 18) were very or fairly satisfied with how they got on with people in general (Figure 4).
- The proportion of cohort Y09 (aged 24) who were very or fairly satisfied with their life at home was higher than that for cohort Y15 (aged 18-year-olds) (89% and 84%, respectively).
However, the proportions who were very or fairly satisfied with their social life were a little lower for both cohorts:
- 76% for cohort Y09 (aged 24) and 75% for cohort Y15 (aged 18).
Figure 4: Satisfaction with social interactions, by LSAY cohort, 2018
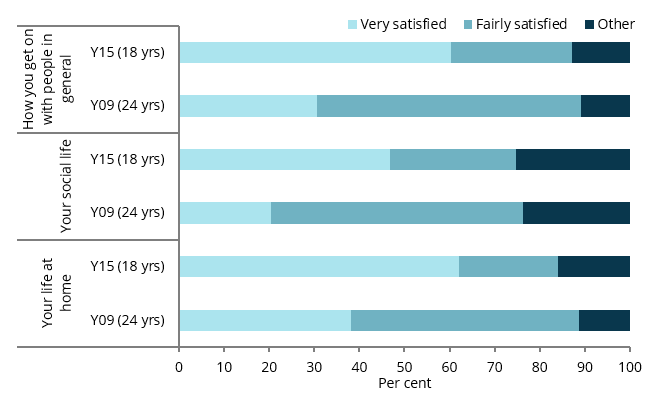
Note: The category ‘Other’ includes neither satisfied nor dissatisfied, fairly dissatisfied, very dissatisfied and don’t know (see Technical notes regarding scale).
Chart: AIHW.
Source: Longitudinal Surveys of Australian Youth, 2015 cohort (version 3.0); 2009 cohort (version 9.0).
Work, and spare time
The proportion of young people satisfied with the work they do, at study, at home or in a job, was:
- higher among cohort Y09 (aged 24) than among cohort Y15 (aged 18) (81% and 76%, respectively) (Figure 5)
The proportion of each cohort satisfied with what they did in their spare time was similar across cohorts:
- 78% of cohort Y09 (aged 24) and 77% of cohort Y15 (aged 18) were very or fairly satisfied with what they did in their spare time.
Figure 5: Satisfaction with work and spare time activities, by LSAY cohort, 2018
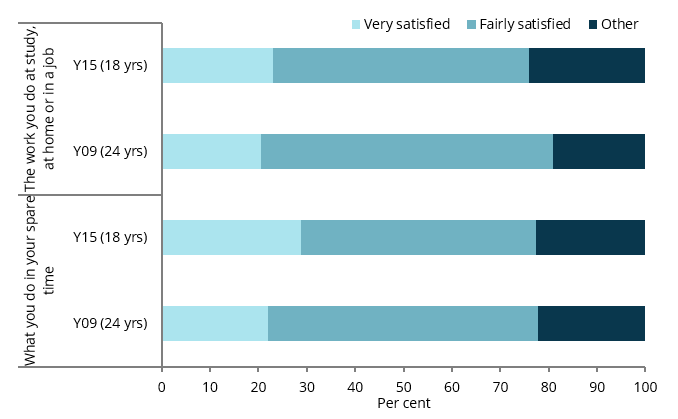
Note: The category ‘Other’ includes neither satisfied nor dissatisfied, fairly dissatisfied, very dissatisfied and don’t know (see Technical notes regarding scale).
Chart: AIHW.
Source: Longitudinal Surveys of Australian Youth, 2015 cohort (version 3.0); 2009 cohort (version 9.0).
Money and living situation
A high proportion of young people in both cohorts were satisfied with their standard of living, and where they lived:
- 90% of cohort Y09 (aged 24) and 88% of cohort Y15 (aged 18) were very or fairly satisfied with their standard of living (Figure 6)
- 85% of cohort Y09 (aged 24) and 84% of cohort Y15 (aged 18) were very or fairly satisfied with where they lived.
However, the proportion who were very or fairly satisfied with the money they get each week was lower for both cohorts, and was:
- lower among cohort Y15 (aged 18) than among cohort Y09 (aged 24) (61% and 70%, respectively).
Figure 6: Satisfaction, living situation and money received, by LSAY cohort, 2018
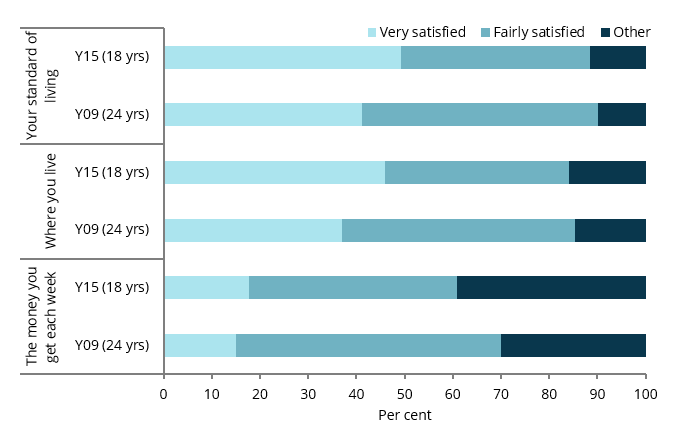
Note: The category ‘Other’ includes neither satisfied nor dissatisfied, fairly dissatisfied, very dissatisfied and don’t know (see Technical notes regarding scale).
Chart: AIHW.
Source: Longitudinal Surveys of Australian Youth, 2015 cohort (version 3.0); 2009 cohort (version 9.0).
Money and living situation
Data items relating to satisfaction with the broader community are included in LSAY from wave 5 onwards when respondents are 19 years old. In this section, data are reported for cohort Y09 (aged 24).
The proportion of those who were fairly or very satisfied with the way the country is run and the state of the economy was considerably lower than the proportions of young people satisfied with other aspects of their lives:
- 35% were fairly or very satisfied with the way the country is run
- 39% were fairly or very satisfied with the state of the economy.
Box 3: Soft skills and resilience
Having strong soft skills is an important part of being resilient, which can enhance wellbeing.
Based on data from the LSAY cohort Y15, among young people aged 17 in 2017:
- 85% strongly agreed/agreed that they can generally see a way out of problem situations. The rate was higher among young males than among young females (89% and 81%, respectively)
- 76% strongly agreed/agreed that they think carefully before reaching conclusions
- 76% strongly agreed/agreed that they compare strengths and weaknesses of different ideas. The rate was higher among young males than among young females (79% and 72%)
- 74% strongly agreed/agreed that they can see problems as challenges to overcome. The rate was higher among young males than among young females (78% and 71%)
- 72% strongly agreed/agreed that when they make decisions they are happy with them later.
Is it the same for everyone?
In the 2019 Mission Australia Youth Survey, young people aged 15–19 were asked to rate how happy they were with their life as a whole and how positive they felt about their future:
- Just over 2 in 5 (43%) young people with disability indicated that they felt happy/very happy with their lives overall, notably lower than for participants without disability (62%).
- More than twice as many respondents with disability reported that they felt very sad/sad with life as a whole (24%) compared with those without disability (10%).
- A much lower proportion of young people with disability than those without disability indicated that they felt very positive or positive about the future (43% compared with 59%) (Hall et al. 2020).
Data limitations and development opportunities
Although subjective wellbeing is generally regarded as an important construct, there is currently no nationally agreed measure for reporting against this.
Where do I find more information?
For information on topics related to subjective wellbeing in Australia’s youth, see:
- Mental illness
- Secondary school education for sense of belonging at school
- Social support domain for satisfaction with relationships.
For information on Indigenous young people and wellbeing, see:
- Chapter 2, Wellbeing of young Indigenous people of Aboriginal and Torres Strait Islander adolescent and youth health and wellbeing 2018
- Measure 1.18 Social & emotional wellbeing of the Aboriginal and Torres Strait Islander Health Performance Framework (HPF) report 2020.