Summary
Chronic respiratory conditions
is an Australia's health
topic
On this page:
Chronic respiratory conditions affect the airways, including the lungs and the passages that transfer air from the mouth and nose into the lungs. These conditions are characterised by symptoms such as wheezing, shortness of breath, chest tightness and cough.
Obstructive lung diseases are diseases that cause more difficulty with exhaling air, such as asthma, chronic obstructive pulmonary disease (COPD) and bronchiectasis.
Restrictive lung diseases are diseases that can cause problems by restricting a person's ability to inhale air, such as pulmonary fibrosis, chronic sinusitis and occupational lung diseases (Leader 2019).
This page focuses on asthma and COPD as these are common respiratory conditions and are associated with poor health and wellbeing.
Chronic respiratory conditions in 2020–21
Data for 2020–21 are based on information self-reported by the participants of the Australian Bureau of Statistics (ABS) 2020–21 National Health Survey (NHS). Using the self-reported data from NHS 2020–21, almost one-third (30%) of Australians reported having chronic respiratory conditions. Of the estimated 7.5 million Australians with these conditions:
- 5.1 million (20% of the total population) had allergic rhinitis ('hay fever')
- 2.7 million (11%) had asthma
- 2.0 million (8.0%) had chronic sinusitis (ABS 2022a).
Previous versions of the NHS have primarily been administered by trained ABS Interviewers and were conducted face-to-face. The 2020–21 NHS was conducted during the COVID-19 pandemic. To maintain the safety of survey respondents and ABS Interviewers, the survey was collected via online, self-completed forms.
Non-response is usually reduced through Interviewer follow up of households who have not responded. As this was not possible during lockdown periods, there were lower response rates than previous NHS cycles, which impacted sample representativeness for some sub-populations. Additionally, the impact of COVID-19 and lockdowns might also have had direct or indirect impacts on people’s usual behaviour over the 2020–21 period.
Due to these changes, comparisons with previous asthma and COPD data over time are not recommended.
On this page, comparisons over time (trends) only contain data from the NHS 2017–18 and prior versions.
How common are chronic respiratory conditions?
According to the NHS, in 2017–18:
- 7.4 million (31%) people in Australia were affected by chronic respiratory conditions
- 2.7 million (11%) people reported having asthma
- 464,000 (4.8%) people aged 45 and over reported having COPD (ABS 2019).
While COPD is occasionally reported in younger age groups, there is more certainty that the condition is COPD and not another respiratory condition for those aged 45 and over. A range of estimates of the prevalence of COPD have been derived from different surveys (for example, Toelle et al. 2013). It is important to note that accurately estimating the prevalence of COPD requires clinical testing.
Prevalence by age and sex
According to the NHS, in 2017–18:
- for those aged 0–14, asthma was more prevalent among boys than girls
- for those aged 15 and over, asthma was more prevalent among females than males
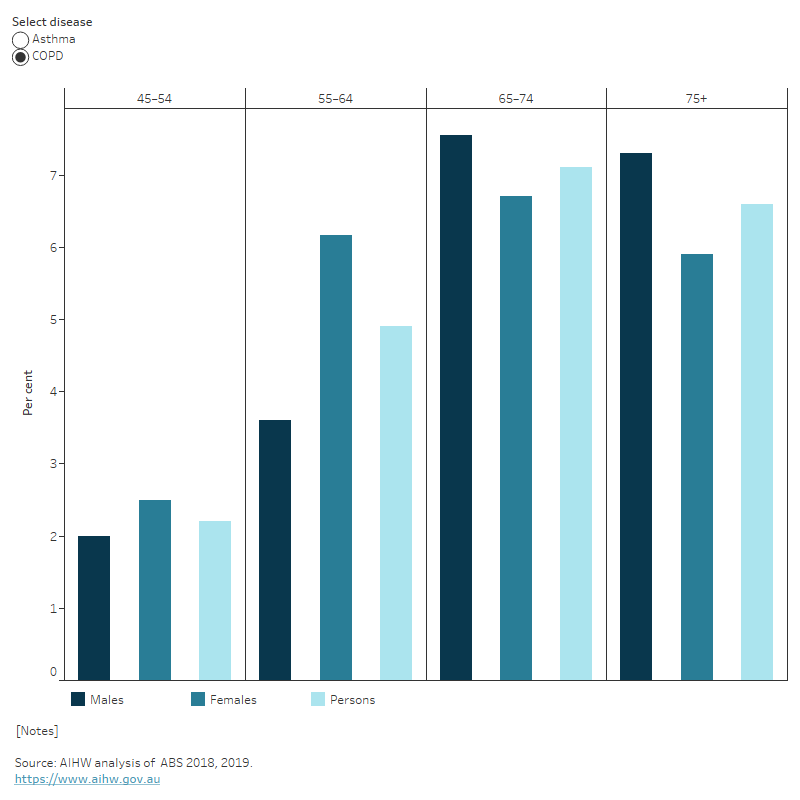
- COPD prevalence increased with age. It was more prevalent in females than males for those aged 55–64; but prevalence was similar between sexes in other age groups (Figure 1).
Figure 1: Prevalence of asthma and chronic obstructive pulmonary disease by sex and age, 2017–18
This figure shows that the prevalence of COPD increased from 2.2% for those aged 45–54 to 7.1% for those aged 65–74.
Trends over time
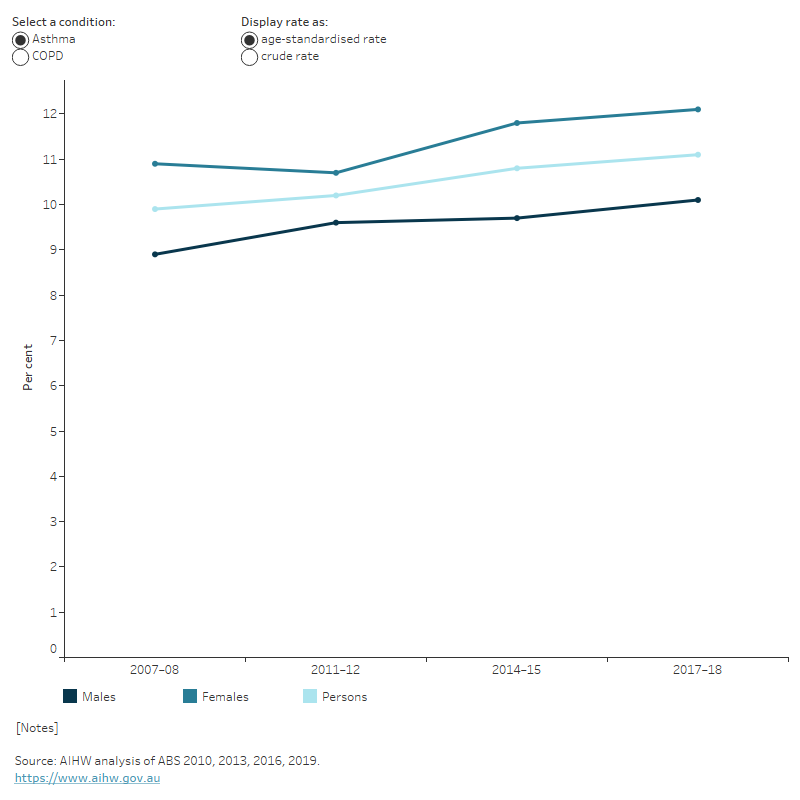
Between 2007–08 and 2017–18, after adjusting for differences in age structure, the prevalence of asthma and COPD remained relatively stable (9.9% to 11%, and 3.9% to 4.6%, respectively) (Figure 2).
For more information, see Asthma and Chronic obstructive pulmonary disease.
Figure 2: Prevalence of asthma and chronic obstructive pulmonary disease by sex, 2007–08 to 2017–18
This figure shows females have a higher rate of asthma compared with males from 2007–08 to 2017–18.
Impact of chronic respiratory conditions
Chronic respiratory conditions have varying degrees of impact on the physical, psychological, and social wellbeing of people living with the conditions, depending on disease severity and their level of control. People with these conditions can also be impacted by one-off natural events which occur on a seasonal basis, such as thunderstorms and bushfires.
Impact of natural events on chronic respiratory conditions
Natural disasters or extreme weather changes can affect human health drastically, and events that affect air quality can have a direct impact on chronic respiratory conditions.
Two natural events that have affected chronic respiratory conditions in recent times are thunderstorm asthma and the bushfires of 2019–20. For more information on Thunderstorm asthma see Asthma and Natural environment and health.
Australian bushfires of 2019–20
The bushfires that swept across Australia in 2019–20 resulted in 33 deaths and the destruction of over 3,000 houses and millions of hectares of land (Parliament of Australia 2020). Bushfire smoke exposure is significantly associated with an increased risk of respiratory morbidity (Liu et al. 2015).
Nationally, hospitalisation and emergency department (ED) presentation rate increases for asthma and COPD coincided with increased bushfire activity during the 2019–20 bushfire season (AIHW 2021a):
- for asthma, the highest hospitalisation rate increase was 36% in the week beginning 12 January 2020 (2.4 per 100,000 population) compared with the previous 5-year average (1.7 per 100,000 population)
- for COPD, the highest hospitalisation rate increase was 30% in the week beginning 1 December 2019 (2.0 per 100,000 population) compared with the previous 5-year average (1.6 per 100,000 population).
- for asthma, the highest ED rate increase was 44% in the week beginning 12 January 2020 (4.7 per 100,000 population) compared with the previous bushfire season (3.3 per 100,000 population)
- for COPD, the highest ED rate increase was 31% in the same week (1.4 per 100,000 population) compared to the previous bushfire season (1.1 per 100,000 population).
For more information see Natural environment and health.
Burden of disease
What is burden of disease?
Burden of disease is measured using the summary metric of disability-adjusted life years (DALY, also known as the total burden). One DALY is one year of healthy life lost to disease and injury. DALY caused by living in poor health (non-fatal burden) are the ‘years lived with disability’ (YLD). DALY caused by premature death (fatal burden) are the ‘years of life lost’ (YLL) and are measured against an ideal life expectancy. DALY allows the impact of premature deaths and living with health impacts from disease or injury to be compared and reported in a consistent manner (AIHW 2022a).
In 2023, the respiratory conditions disease group accounted for 7.2% of total disease burden (DALY); 8.5% of non-fatal burden (YLD), and 5.8% of fatal burden (YLL) (AIHW 2023a).
Variation by age and sex
In 2023:
- the rate of burden for the respiratory conditions disease group varied between 6.4 and 8.4 DALY per 1,000 population between the ages of 10–14 and 45–49, then increased steeply, peaking at 54.8 DALY per 1,000 population for those aged 75–79
- the rate of burden for the respiratory conditions disease group was split between COPD and asthma:
- COPD accounted for 50% of total burden (DALY), 38% of non-fatal burden (YLD), and 71% of fatal burden (YLL)
- asthma accounted for 35% of total burden (DALY), 52% of non-fatal (YLD), and 5.4% of fatal burden (YLL)
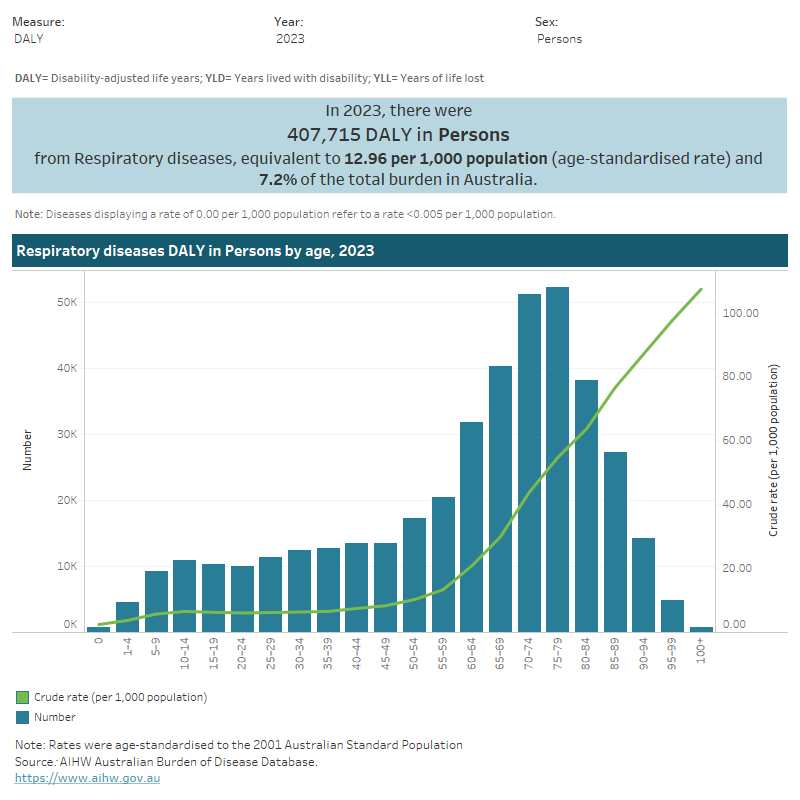
- among individual conditions, COPD was the fifth leading cause of total burden of disease. Asthma was ranked tenth, but was the leading cause of total burden among children aged 1–9 (Figure 3).
Figure 3: Burden of disease due to respiratory conditions by sex, age and year
This figure shows that in 2023 the total burden of disease due to respiratory conditions was higher for females compared with males.
Trends over time
Between 2003 and 2023, the age standardised rate of respiratory conditions burden decreased by 6% (13.8 to 13.0 DALY per 1,000 population, respectively) – or 0.3% per year on average.
For more information, see Australian Burden of Disease Study 2023.
Variation between population groups
In 2018, the age standardised rate of respiratory condition burden:
- was highest for people living in Remote and very remote areas and lowest for people living in Major cities (18.0 and 12.3 DALY per 1,000 population, respectively)
- was highest for people living in the lowest socioeconomic areas (with the highest level of disadvantage) and lowest for people living in the highest socioeconomic areas (with the lowest level of disadvantage) (6.7 and 2.4 YLL per 1,000 population, respectively) (AIHW 2021b) (Figure 4).
For more information, see Australian Burden of Disease Study 2018: Interactive data on disease burden.
Figure 4: Burden of disease due to respiratory conditions for remoteness area and socioeconomic group by sex and year
This figure shows there has been little change in burden of disease due to respiratory conditions by remoteness area and socioeconomic group between 2011 and 2018.

Health system expenditure
In 2020–21 an estimated $4.5 billion of expenditure in the Australian health system was for respiratory conditions, representing 3.0% of total health expenditure (AIHW 2023b).
Where is the money spent?
In 2020–21:
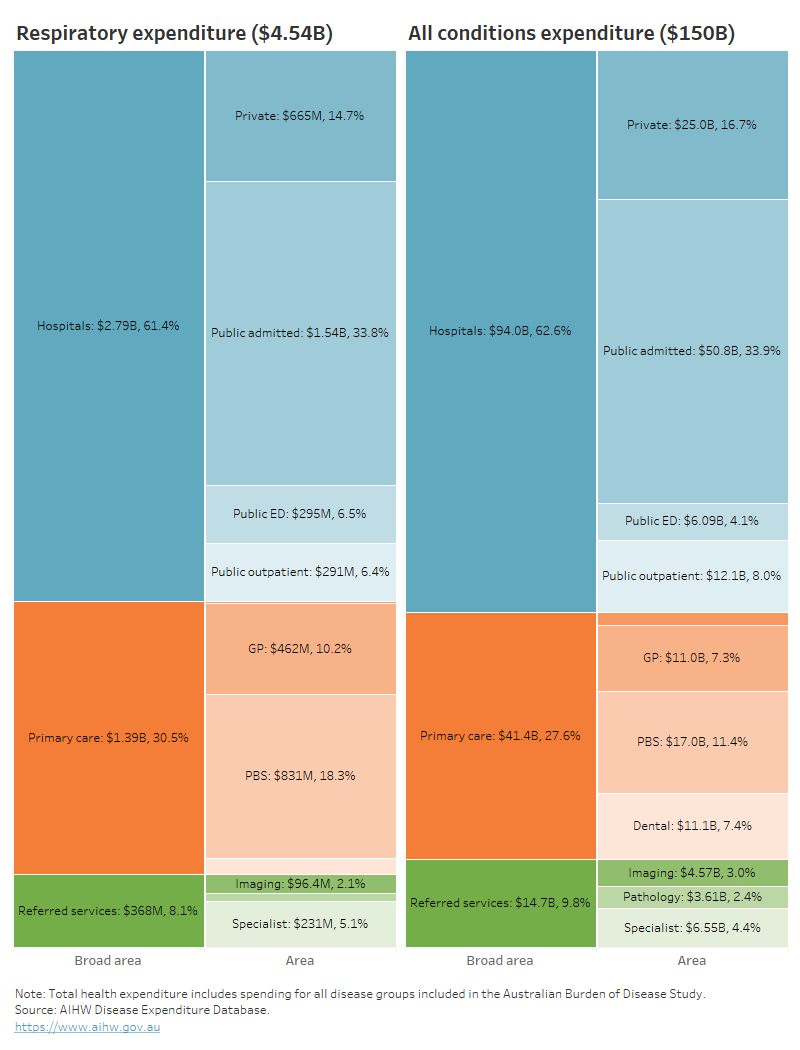
- hospital services represented 61% ($2.8 billion) of respiratory expenditure, which was very similar to the hospital proportion for all disease groups (63%). However, the public emergency department proportion of respiratory expenditure was 1.6 times the proportion for all disease groups (6.5% compared with 4.1%)
- primary care accounted for 31% ($1.4 billion) of all respiratory condition spending, which was similar to the primary care portion for all disease groups. However, the Pharmaceutical Benefits Scheme (PBS) proportion of respiratory expenditure was 1.6 times more than the proportion for all disease groups (18% compared with 11%)
- referred medical services represented 8.1% ($368.2 million) of expenditure for respiratory conditions, which was similar to the proportion for all disease groups (9.8%) (Figure 5).
Figure 5: Respiratory conditions expenditure attributed to each area of the health system, with comparison to all disease groups, 2020–21
This figure shows the public admitted patient proportion of respiratory expenditure was 34%, or 1.5 billion.
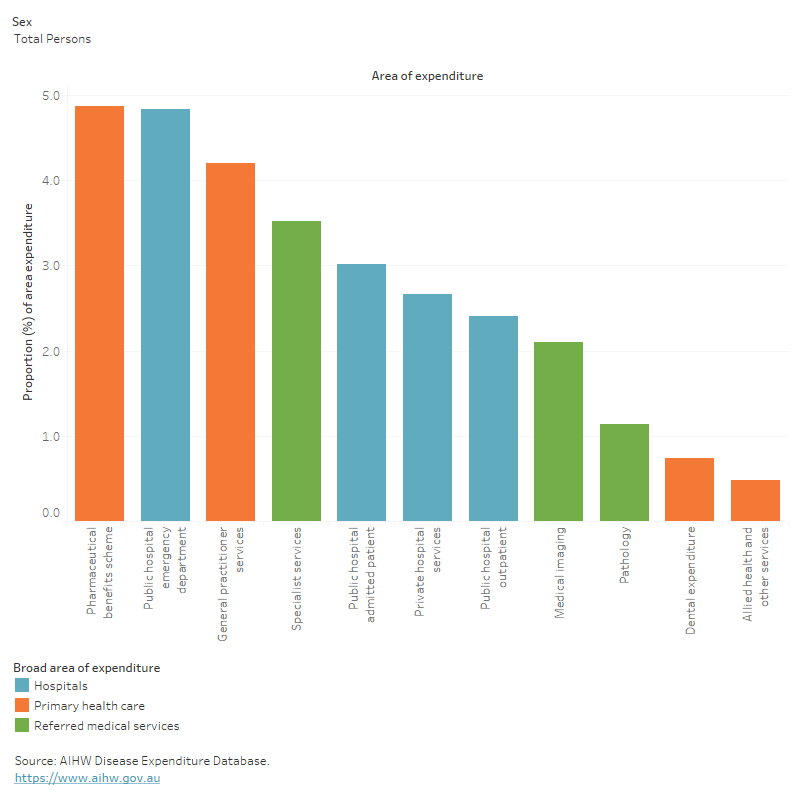
In 2020–21, respiratory conditions accounted for:
- 4.9% ($830.9 million) of all PBS expenditure (Figure 6)
- 4.8% ($294.8 million) of all public hospital emergency department expenditure.
Figure 6: Proportion of expenditure attributed to respiratory conditions, for each area of the health system, 2020–21
This figure shows respiratory conditions accounted for 4.2% of all general practitioner services expenditure.
Who is the money spent on?
In 2020–21:
- the age distribution of spending on respiratory conditions reflects the prevalence distribution, with most spending being for older age groups (63% for people aged 45 and over)
- the distribution of spending on respiratory conditions was similar amongst females and males ($2.2 billion and $2.3 billion, respectively).
For more information, see Health system spending on disease and injury in Australia, 2020-21.
In 2018–19, it was estimated that respiratory condition expenditure per case was:
- 10% higher for males compared with females ($530 and $480 per case, respectively)
- 74% lower than expenditure per case for all disease groups $510 and $2,000 per case, respectively) (AIHW 2022b).
For more information, see Health system spending per case of disease and for certain risk factors.
How many deaths were associated with chronic respiratory conditions?
In 2021:
- respiratory conditions were recorded as an underlying and/or associated cause for 46,551 deaths or 135 deaths per 100,000 population in Australia, representing 27.1% of all deaths
- respiratory conditions were the underlying cause for 13,593 deaths (29% of respiratory deaths) and an associated cause only, for 32,958 deaths (71% of respiratory deaths)
- COPD and asthma accounted for 52% and 2.6% of underlying-cause respiratory deaths, respectively. Furthermore, they contributed to 36% and 4.3% of any-cause respiratory deaths.
Variation by age and sex
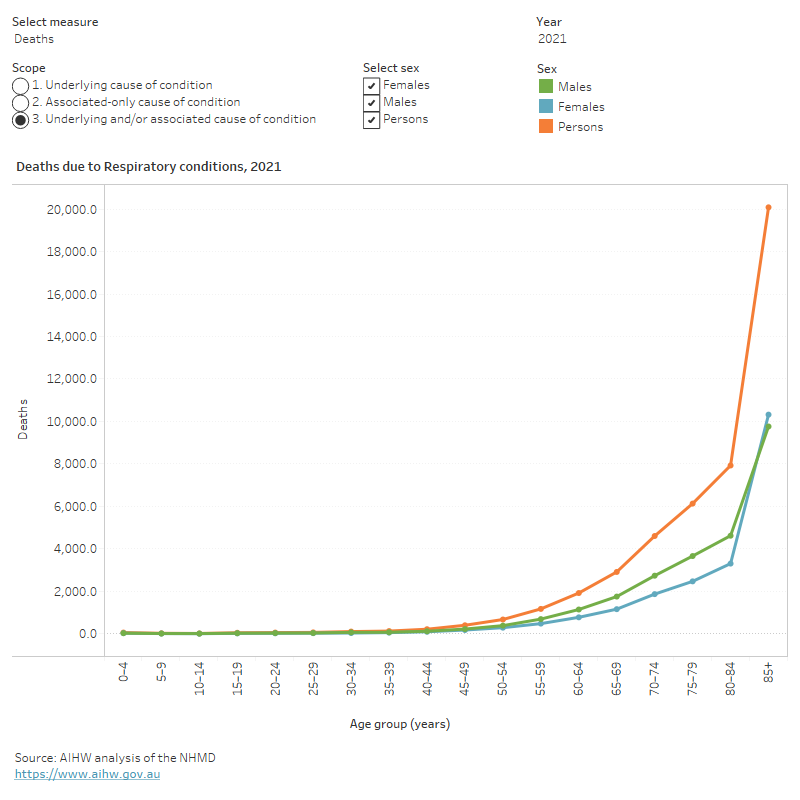
In 2021, respiratory conditions mortality (as the underlying and/or associated cause) in comparison to all deaths, was relatively more concentrated among:
- older people (73% of respiratory deaths were among people aged 75 and over, compared with 67% for total deaths)
- males (55% of respiratory deaths were among males compared with 52% of total deaths) (Figure 7).
Figure 7: Age distribution for respiratory conditions mortality, by sex, 2011 to 2021
This figure shows that death rates due to respiratory conditions increased with age and were highest for people aged 85 and over.
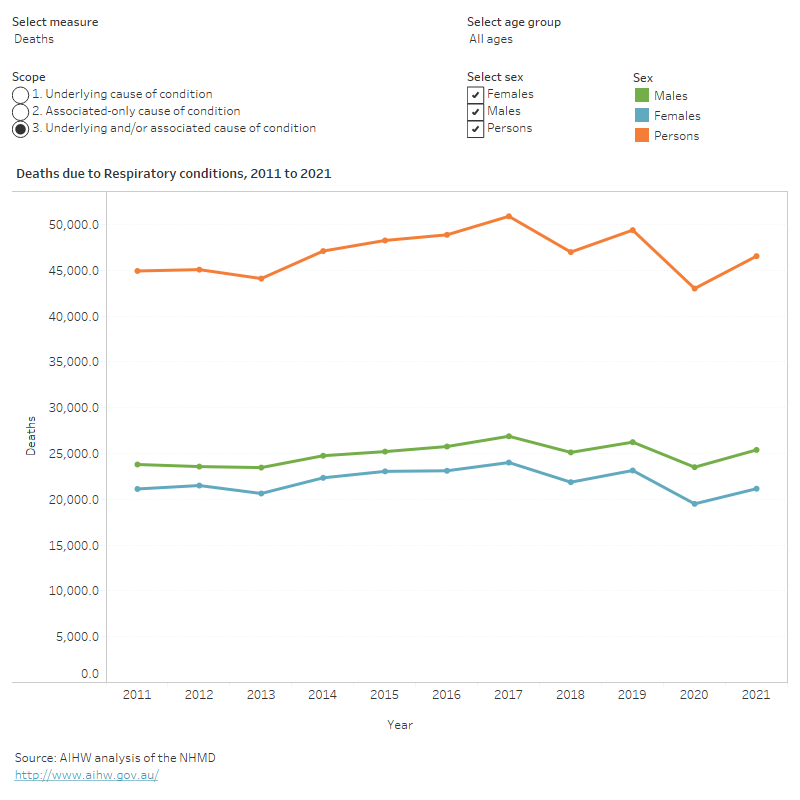
Trends over time
Age standardised mortality rates for respiratory conditions (as the underlying and/or associated cause) between 2011 and 2021:
- trended down from 172 to 135 per 100,000 population
- were 1.5 to 1.6 times as high as for males compared with females (Figure 8).
Figure 8: Trends over time for respiratory conditions mortality, 2011 to 2021
This figure shows that between 2011 and 2021, deaths rates due to respiratory conditions were highest in 2017 and lowest in 2020.
Variation between population groups
In 2021, age standardised mortality rates for respiratory conditions (as the underlying and/or associated cause of death) were:
- highest for people living in Remote and very remote areas and lowest for people living in Major cities (183 and 129 per 100,000 population, respectively)
- highest for people living in the lowest socioeconomic areas (with the most level of disadvantage) and lowest for people living in the highest socioeconomic areas (with the least disadvantage) (160 and 94 per 100,000 population, respectively).
Treatment and management of chronic respiratory conditions
Primary care
General practitioners (GPs) play an important role in managing chronic respiratory conditions in the community, but there is currently no nationally consistent primary health care data collection to monitor provision of care by GPs.
For more information, see General practice, allied health and other primary care services.
Hospital treatment
People with chronic respiratory conditions require admission to hospital when they cannot be managed at home or by a GP, or their symptoms exacerbate acutely. Hospitalisations due to asthma and COPD are classified as potentially preventable. Data from the National Hospital Morbidity Database (NHMD) show that in 2020–21:
- asthma was the principal diagnosis in 25,500 hospitalisations for people of all ages
- COPD was the principal diagnosis in 54,400 hospitalisations for people aged 45 and over.
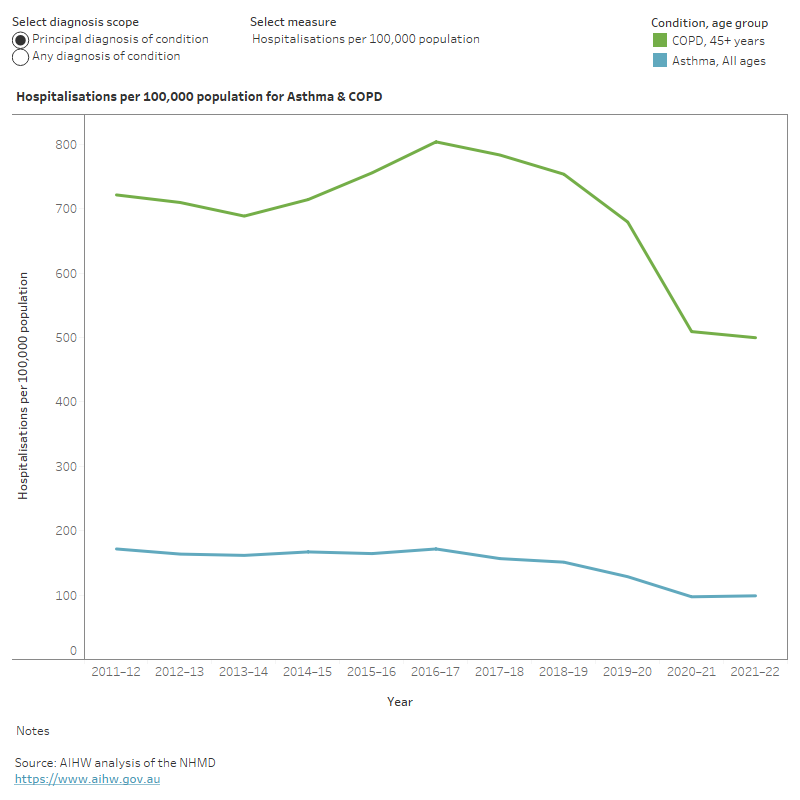
From 2011–12 to 2021–22, the hospitalisation rate for:
- asthma decreased from 170 to 100 per 100,000 population
- COPD for people aged 45 years and over, decreased steeply from 2016–17 to 2021–22 (805 to 500 per 100,000 population) (Figure 9).
Figure 9: Age distribution for asthma and chronic obstructive pulmonary disease hospitalisations, by sex, 2011–12 to 2021–22
This figure shows that between 2011–12 and 2021–22, hospitalisation rates for asthma decreased by 42% and for COPD, rates decreased by 36%.
COVID-19 impact on chronic respiratory conditions
The overall rate of hospitalisations and emergency department presentations decreased at the start of the COVID-19 pandemic. The hospitalisation rates for asthma and COPD in 2019–20 and 2020–21 were the lowest recorded in the last 10 years. This was potentially attributable to an indirect impact of the COVID-19 pandemic and the health protection measures put in place which supported physical distancing, promotion of hand-hygiene and mask wearing. See ‘Chapter 2 Changes in the health of Australians during the COVID-19 period’ in Australia’s health 2022: data insights.
During the national lockdown beginning on 23 March 2020 following the pandemic outbreak, emergency department presentations for asthma and COPD decreased:
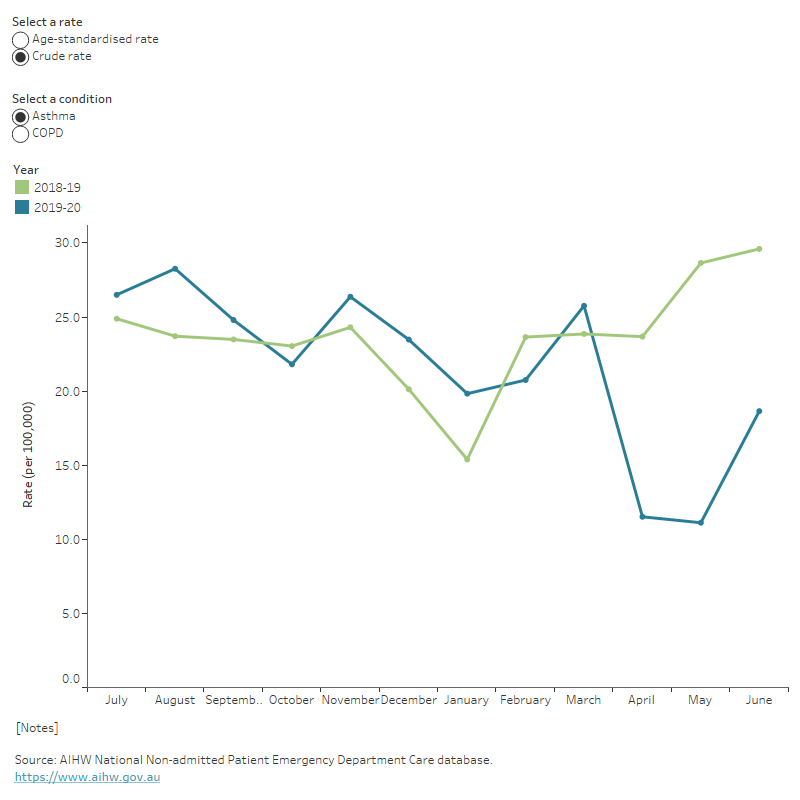
- For asthma, rates decreased from March to May 2020 (26 to 11 per 100,000 population). In June 2020, when restrictions began to ease across the country, rates increased to 19 per 100,000 population (Figure 10). When compared with April and May in 2019, the rates of asthma presentations observed in 2020 were halved.
- For COPD, rates decreased from March to April 2020 (39 to 28 per 100,000 population). This rate increased slightly in May and June 2020 (30 and 33 per 100,000 population). When compared with April and May in 2019, the rates of COPD presentations observed in 2020 fell by 29% and 34%, respectively (Figure 10).
Figure 10: Monthly emergency department presentation rates for asthma and chronic obstructive pulmonary disease (45 years and over), 2018–19 compared with 2019–20
This figure shows that in 2019–20, emergency department presentations were highest in August for asthma and in July for COPD.
Death rates from all respiratory diseases combined showed a substantial fall in 2020, with rates particularly low for females and during the winter months compared with previous years. This is discussed in detail in ‘Chapter 2 Changes in the health of Australians during the COVID-19 period’ in Australia’s health 2022: data insights.
During the COVID-19 pandemic (as at 31 October 2022), chronic respiratory conditions were certified as a pre-existing condition in 18% of the deaths with a chronic condition mentioned, the third highest of all chronic conditions (ABS 2022b). Between January and August 2022, the overall deaths due to chronic respiratory conditions were slightly higher (2.5%) than historical average for the same period (Figure 11).
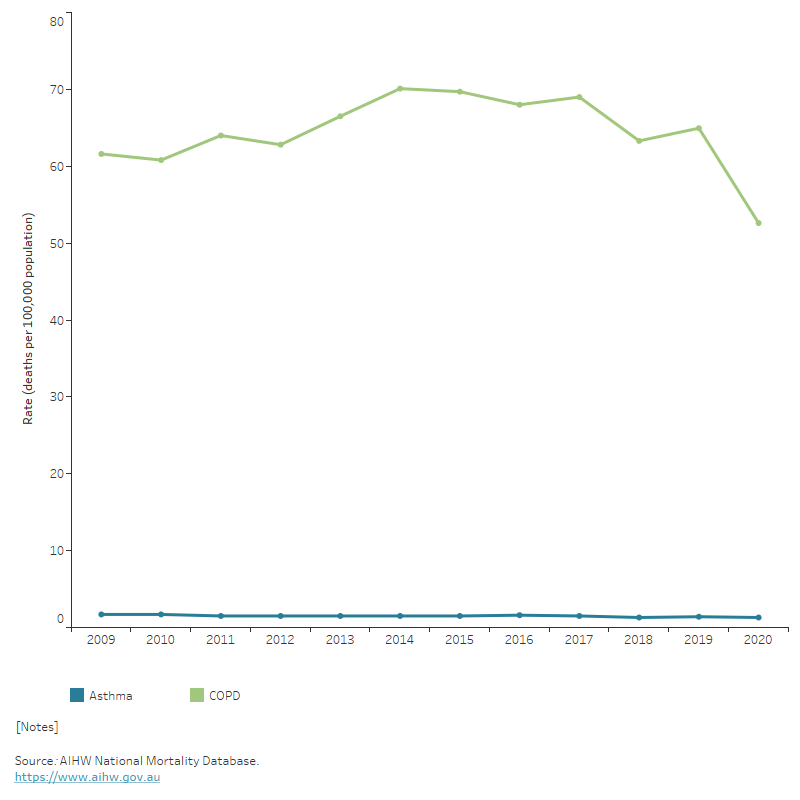
Figure 11: Age-standardised deaths rate due to asthma and chronic obstructive pulmonary disease, 2009 to 2020
This figure shows the rate of deaths due to COPD among people aged 45 and over was 53 per 100,000 population in 2020.
While the long-term impact of COVID-19 on the respiratory system is being researched, evidence shows that COVID-19 does not directly impact the risk of increasing asthma severity and vice versa (Lee et al. 2020; Lieberman-Cribbin et al. 2020; Mather et al. 2021). However, there is increasing evidence showing that COPD patients with COVID-19 have greater risk of mortality, severity of infection and higher likelihood of requiring Intensive Care Unit (ICU) support than those without COPD (Cazzola et al. 2021; Clark et al. 2021; Wells 2021).
See ‘Chapter 1 The impact of a new disease: COVID-19 from 2020, 2021 and into 2022’ in Australia’s health 2022: data insights.
Comorbidities of chronic respiratory conditions
People with chronic respiratory conditions often have other chronic and long-term conditions (comorbidities). In the 2017–18 NHS, for people aged 45 and over with:
- asthma: 81% had at least one other chronic condition; among them, 49% had arthritis and 37% had back problems. For more information, see Asthma
- COPD: 90% had at least one other chronic condition; among them, 55% had arthritis and 43% had asthma. For more information, see COPD.
Where do I go for more information?
For more information on chronic respiratory conditions, see:
- ABS National Health Survey: first results (2017–18)
- ABS Health Conditions Prevalence
- Australian Centre for Monitoring Population Health.
For more on this topic, visit Chronic respiratory conditions.
ABS (Australian Bureau of Statistics) (2019), Microdata and Table Builder: National Health Survey, ABS Website, accessed 18 February 2022.
ABS (2022a) Health conditions prevalence, ABS website, accessed 21 March 2022.
ABS (2022b) COVID-19 Mortality in Australia: Deaths registered until 31 October 2022, ABS website, accessed 21 March 2022.
AIHW (Australian Institute of Health and Welfare) (2021a) Data update: Short-term health impacts of the 2019–20 Australian bushfires, AIHW, Australian Government, accessed 15 March 2022.
AIHW (2021b) Australian Burden of Disease Study 2018: Interactive data on disease burden, AIHW, Australian Government, accessed 22 May 2023.
AIHW (2022a) Australian Burden of Disease Study 2022, AIHW, Australian Government, accessed 19 May 2023. doi:10.25816/e2v0-gp02.
AIHW (2022b) Health system spending per case of disease and for certain risk factors, AIHW, Australian Government, accessed 19 May 2023.
AIHW (2023a) Australian Burden of Disease Study 2023, AIHW, Australian Government, accessed 14 December 2023.
AIHW (2023b) Health system spending on disease and injury in Australia, 2020-21, AIHW, Australian Government, accessed 14 December 2023.
Cazzola M, Ora J, Bianco A, Rogliani P and Matera MG (2021) Management of COPD patients during COVID: difficulties and experiences, Expert Review of Respiratory Medicine, 15(8):1025–1033, doi:10.1080/17476348.2021.1929176.
Clark M, Tran U and Quach J (2021) COVID-19 Has Devastating Effects for Patients Suffering From COPD, Pharmacy Times website, accessed 9 February 2022.
Leader D (2019) An overview of Obstructive vs. Restrictive Lung Diseases, Verywell health website, accessed 15 March 2022.
Lee SC, Son KJ, Han CH, Jung JY and Park SC (2020) Impact of comorbid asthma on severity of coronavirus disease (COVID-19), Scientific Reports, 10(1):1–9, doi:10.1038/s41598-020-77791-8.
Lieberman-Cribbin W, Rapp J, Alpert N, Tuminello S and Taioli E (2020) The impact of asthma on mortality in patients with COVID-19, Chest, 158(6):2290–2291, doi:10.1016/j.chest.2020.05.575.
Liu JC, Pereira G, Uhl SA, Bravo MA and Bell ML (2015) A systematic review of the physical health impacts from non-occupational exposure to wildfire smoke, Environmental Research, 136:120–132, doi:10.1016/j.envres.2014.10.015.
Mather JF, Mosleh W and McKay RG (2021) The impact of asthma on in-hospital outcomes of COVID-19 patients, Journal of Asthma, 29:1–7, doi:10.1080/02770903.2021.1944187.
Parliament of Australia (2020) 2019–20 bushfires–frequently asked questions: a quick guide, Parliament of Australia, Australian Government, accessed 12 June 2022.
Toelle BG, Xuan W, Bird TE, Abramson MJ, Atkinson DN, Burton DL, James AL, Jenkins CR, Johns DP, Maguire GP, Musk AW, Walters EH, Wood-Baker R, Hunter ML, Graham BJ, Southwell PJ, Vollmer WM, Buist AS and Marks GB (2013) Respiratory symptoms and illness in older Australians: The Burden of Obstructive Lung Disease (BOLD) study, Medical Journal of Australia, 198(3):144–148, doi:10.5694/mja11.11640.
Wells AD (2021) COPD and COVID-19 can be a deadly combination, Methodist Health System website, accessed 11 February 2022.