On this page
- From the Director
- Transforming the business – the AIHW's Innovative Institute project
- National Aged Care Data Clearinghouse – making aged care data more accessible
- Dynamic data display provide insight into adoption statistics
- Digital by design – the AIHW's Musculoskeletal conditions compendium
- Diversion from criminal justice system into drug treatment programs doubles over the last 10 years
- Cervical cancer reduced due to screening
- Triple threat – cardiovascular disease, diabetes and chronic kidney disease
- Australian's living longer, with more years free of disability
- Football and fractures – which sports are more likely to land you in hospital and why
- Falling rates of young people in detention in Australia
- New releases
From the Director
Hello, and welcome to this, my first, and the Institute's 39th issue of AIHW Access.
The AIHW has an enviable reputation for producing quality work that is highly valued by a wide range of stakeholders. Even so, the Institute continues to build on its strengths to develop and deliver useful, user-focused outputs that help all Australians.
As you read through the pages of this issue, here at the Institute, our statisticians, graphic designers and web team are busy putting the finishing touches on Australia's welfare 2015.
A program of innovation, begun last year and covered in this issue, has set the course for a systematic approach to improving our product offerings.
Over the last year, the Institute has seen many changes. In July 2014, the AIHW moved from a small 'campus' of three buildings to purpose-built premises at 1 Thynne Street in Bruce.
The new AIHW building was officially opened in November 2014 by the then Minister for Health and Minister for Sport, The Hon. Peter Dutton.
December 2014 saw the appointment of The Hon. Sussan Ley, as Minister for Health and Minister for Sport, and of The Hon. Scott Morrison as Minister for Social Services.
It also saw former AIHW Director, David Kalisch, appointed as the 15th Australian Statistician of the Australian Bureau of Statistics.
In January, I joined the Institute as its acting Director, after serving on the AIHW Board for 3 years.
My background has spanned health reform, hospitals, workforce and dental policy – working as a Deputy Secretary in the Australian Government Department of Health. Between 2003 and 2006 I was head of the Commonwealth Office for Women, and from 1992 to 2003 worked in the Department of Family and Community Services on programs for older Australians, housing and homelessness and community development. I have worked closely with states and territories through various committees and cross-jurisdictional working parties.
All of this means I have a deep appreciation for what the AIHW does and the contribution it makes in providing independent and authoritative health and welfare information and statistics to help improve the health and wellbeing of all Australians.
I'm very pleased to be leading such an important agency at such an exciting time and am delighted to be able to invite you to explore this issue of AIHW Access magazine.

Kerry Flanagan PSM
Acting Director (CEO), AIHW
Transforming the business – the AIHW's Innovative Institute project

Making the AIHW a more innovative and collaborative organisation was always an objective of the Business Transformation Program – a program that develops initiatives to improve the Institute's effectiveness and efficiency and the quality and timeliness of its products. Earlier work to build a core infrastructure, which included a project management framework, workflows and knowledge management components, underpinned many of the changes expected to flow from the Innovative Institute project.
The Innovative Institute project kicked off in the middle of 2014 when consulting company Raw Innovation, who came with a well-developed innovation methodology that had been tested in a variety of environments, was engaged to facilitate the project.
Two innovation projects were identified: one around work practices that focused on how to capitalise on the Institute's new physical environment to foster collaboration and innovation, and a second around outputs that focused on how to provide information to stakeholders in ways that best met their various needs. These projects were dubbed 'Institute Works' and 'Product Plates' respectively.
The projects were run simultaneously, each with a cross-functional high-performing team of around 20 staff at various levels. The teams were empowered with:
- a rigorous innovation process
- key innovation personas and behaviours required to build a culture of innovation
- new skills and tools to assist innovative thinking
- tips on how to facilitate and drive innovation across the organisation.
Process
The six-stage Raw Innovation Process ™ was undertaken for each project. Stage 1, Identify, was about getting the brief right. Stage 2, Immersion, gathered first-hand experiences and ideas ('clues') from a variety of stakeholders. In stage 3, Insight, clues drawn from the immersion stage were examined to identify insights and opportunities. Stage 4, Ideas, identified key ideas to take forward and test. Stage 5, Impact, consisted of reviewing and prioritising the best ideas and workshopping suggestions for improvements.
We're now beginning stage 6 of the Innovative Institute Project, Implementation, where winning ideas will be implemented and managed by AIHW service and/or business units. While stage 6 is just getting underway, many staff are already applying their newly acquired skills to build and foster a collaborative culture of innovation. An example is one of the AIHW's flagship publications, Australia's welfare.
Work on the forthcoming Australia's welfare 2015 was initiated with an 'ideas day' in which all staff were invited to participate. The resulting enthusiasm and influx of fresh ideas from both junior and senior staff alike was refreshing and inspiring and once again demonstrated that AIHW staff are dedicated and committed to providing Australia with information of the highest possible quality.
Other teams have employed similar strategies to approach their work with fresh eyes and to provide the best possible outcomes for their stakeholders. For more on innovation at the AIHW, read the following article National Aged Care Data Clearinghouse – making aged care data more accessible.
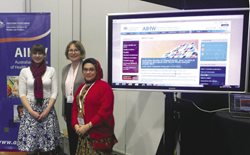
National Aged Care Data Clearinghouse – making aged care data more accessible

The AIHW National Aged Care Data Clearinghouse (the Data Clearinghouse) is an independent and central repository of national aged care data. The Data Clearinghouse was launched in July 2013 and represents a major step towards improving the availability of aged care information and statistics in Australia. It encourages transparency and independence in aged care policy research and evaluation through the provision of data and information for research, evaluation and analysis. This in turn helps to ensure the best possible outcomes for the community.
Using the 'Raw Innovation Process™' the AIHW's Disability and Ageing team took up the challenge of creating a more collaborative and innovative working environment in order to produce a broader range of products to serve clients, stakeholders and the public.
Late last year, the team hosted an ideas workshop with a diverse range of stakeholders, including policy makers, academics and aged care service providers.
The aim of the workshop was to gather and discuss ideas from beyond the usual stakeholder networks, and to identify common themes of interest that the AIHW could map against the existing information and data products, with the goal of expanding or enhancing these products to address gaps.
Prior to the workshop, the team conducted a review of all the information and data requests received by the Data Clearinghouse to date. The team also undertook a stocktake and review of all the current AIHW ageing and aged care web pages.
Finally, the team surveyed stakeholder networks seeking input into the types of ageing and aged care information and data that were of interest and the methods people used to access them.
At the ideas workshop participants considered the results of the two reviews and the survey responses to find common themes, which were workshopped by the group into concepts on how these themes could be presented – what types of information and data products would work, what the gold standard would be, and what would be feasible for AIHW to achieve.
These concepts were then explored further by the Disability and Ageing Team at the AIHW and a suite of information and data products, some new and some adaptations to the current products, were identified for development. New products will address the following identified themes:
- status of the aged care sector
- information for consumer and provider planning
- data inventory and data gaps
- expanding information on ageing and the health of older Australians.
Kate Spyby of the Disability and Ageing Unit said, 'the process provided the team with the opportunity to engage with different stakeholders and encourage creative problem solving. The resulting themes will be valuable in planning for the future'.
Dynamic data display provides fresh insight into adoption statistics

There were 317 adoptions finalised in Australia in 2013–14, according to the latest report in the AIHW's Adoptions Australia series.
Tim Beard, AIHW spokesperson said, 'this was down 9% from the previous year, reflecting the fact that while the number of Australian children adopted was similar to the previous year, the number of children adopted from overseas continues to decline'.
Of the 317 finalised adoptions in 2013-14, 203 were of children who were born or were permanently residing in Australia—a slight decrease from the 210 in the previous year—while the number of finalised intercountry adoptions dropped more dramatically, from 129 to 114.
The most common countries of origin for overseas adoptions were Taiwan (41 adoptions) the Philippines (18) and South Korea (13).
Processing times are plateauing
Overall processing times for intercountry adoptions (covering processes in Australia and overseas) are beginning to stabilise, with the median length of time remaining at around 5 years, and most of that time taken up by overseas processes.
'Intercountry processing times are largely affected by factors such as the number and characteristics of children in need of adoption, the number of applications received, and the resources of the overseas authority—all factors outside the control of Australian authorities', said Sam Chambers, the analyst who worked on a new dynamic data display tool.
Carer adoptions have tripled
While adoptions of most kinds continue to fall, the report shows that those by known carers were triple that of a decade ago—at about 28% of all finalised adoptions in 2013–14.
'The 89 adoptions by known carers, such as foster parents, was the highest number of this type of adoption in the past decade', Mr Beard said.
Dynamic data display
Launched alongside Adoptions Australia 2013–14, the intercountry adoptions dynamic data display allows users to explore data to find out more about trends and patterns of adoptions in Australia.
Download Adoptions Australia 2013–14
Digital by design – the AIHW's Musculoskeletal conditions compendium
 Digital by design' refers to information that has been designed, from the outset, to be consumed online. In a move that aligns with the government's aim to make more information available online, the AIHW recently released a web-based musculoskeletal conditions compendium.
The online compendium provides quick and easy access to information about common musculoskeletal conditions and makes available additional resources including fact sheets and PowerPoint slides.
The AIHW's musculoskeletal monitoring centre staff attended the Australian Rheumatology Association Conference held in Adelaide on 23–26 May 2015. The event provided the opportunity to showcase the new compendium and provide delegates with copies of musculoskeletal fact sheets and a handy bookmark filled with quick facts!
Key findings from the release show that 28% of Australians (around 6.1 million people), have arthritis and other musculoskeletal conditions.
About 3.3 million Australians (1 in 7 people), reported having some form of arthritis in 2011–12. Women continued to be most affected by all forms of arthritis, accounting for over 60% or 2 million of self-reported cases.
Osteoarthritis, a degenerative condition of joints such as hips, knees and ankles affects about 1.8 million Australians.
Rheumatoid arthritis, a condition marked by inflammation of the joints causing inflammation, swelling and stiffness, affects almost half a million people.
About 3 million Australians reported having back problems in 2011–12, and according to Global Burden of Disease estimates, low back pain is ranked first in Australasia (including Australia and New Zealand).
In 2008–09, at least $5.7 billion was spent on arthritis and other musculoskeletal conditions. Of this, $1,637 million was spent on osteoarthritis, $1,177 million on back problems, $355 million on rheumatoid arthritis and $305 million on osteoporosis.
The Musculoskeletal conditions compendium contains a range of information and statistics on rheumatoid arthritis, osteoarthritis, juvenile arthritis, osteoporosis and back problems presented in user-friendly formats. Information covers what each disease is, who gets it, how it is treated, quality of life, and expenditure.
Diversion from criminal justice system into drug treatment programs doubles over last 10 years
 An AIHW report looking at programs aimed at directing people who have been apprehended or sentenced with a minor drugs offence away from the criminal justice system, shows that the number of treatment episodes provided to people diverted from the criminal justice system into alcohol and other drug (AOD) treatment programs, more than doubled in the 10 years to 2012–13.
The report, Alcohol and other drug treatment and diversion from the Australian criminal justice system 2012-13, shows that 24,069 clients who received AOD treatment in 2012–13 had been diverted from the criminal justice system.
Geoff Neideck, Head of the AIHW's Housing and Specialised Services Group, said 'the number of clients diverted into treatment and receiving services in 2012–13 comprised 24% of all AOD clients'.
Cannabis the drug of concern
Diversion treatment episodes were about twice as likely to involve cannabis as the principal drug of concern compared with episodes for non-diversion clients. Cannabis was the principal drug of concern for 43% of diversion treatment episodes compared with 20% for non-diversion episodes.
This was followed by alcohol (21% compared with 46%), amphetamines (18% compared with 13%) and heroin (7% compared with 8%).
Young, male and non-Indigenous
Diversion clients were generally younger than other AOD treatment clients (25% were aged 10–19 compared with 11% of non-diversion clients), and more likely to be male (80% and 67% respectively). They were also less likely to be Indigenous, with 12% of diversion clients identifying as Indigenous, compared with 15% of non-diversion clients.
Two programs target severity of offences
There are two main types of diversion programs commonly used in Australia—police diversion and court diversion.
Police diversion occurs when an offence is first detected by a law enforcement officer, and usually applies for minor use or possession offences.
Court diversion occurs once a charge is laid and usually involves offences where criminal behaviour was related to drug use, for example, burglary.
The two diversion types varied in the intensity and mix of treatment types.
Police diversion episodes were far less likely than court diversion episodes to involve counselling, and support and case management only as main treatment types, and much more likely to involve information and education only, and assessment only.
Police diversion:
Counselling 21%
Support and case management only 1%
Information and education only 46%
Assessment only 31%
Court diversion:
Counselling 54%
Support and case management only 15%
Information and education only 20%
Assessment only 5%
Download Alcohol and other drug treatment and diversion from the Australian criminal justice system: 2012–13
Cervical cancer reduced due to screening
 An interesting finding from the recent AIHW report, Cervical screening in Australia 2012–2013, is that the detection of high grade abnormalities reached historically low rates in two age groups; for women aged under 20, and those aged 20–24.
Head of the Cancer and Screening Unit, Justin Harvey said 'This is largely due to the introduction of the National Human Papillomavirus (HPV) Vaccination Program in schools for young girls in 2007, which was subsequently extended to teenage boys'.
Cervical cancer is a rare outcome of persistent infection with one or more of the cancer-causing types of HPV, and is a largely preventable disease. Vaccination can prevent infection of cervical cells with HPV that lead to abnormalities. Also, most types of cervical cancer have a pre-cancerous stage that can last for many years prior to the development of invasive disease. The longer pre-cancerous stage provides an opportunity for early detection and treatment of high grade abnormalities, which can prevent the development of cervical cancer.
Vaccination and screening are the main prevention strategies implemented in Australia. Current policy recommends 2-yearly Pap tests for vaccinated and unvaccinated women.
In 2012–2013, more than 3.8 million, or nearly 6 in 10, women in the target age group (20–69) participated in the National Cervical Screening Program, a level unchanged from the previous two years.
There was increasing participation in the screening program with increasing socioeconomic status. Participation rates ranged from 52% in areas of lowest socioeconomic status to 64% in areas of highest socioeconomic status.
There were 682 new cervical cancer cases diagnosed in 2011, and 143 women died from cervical cancer in 2012.
'This is equivalent to between 9 and 10 new cases of cervical cancer and 2 deaths from cervical cancer per 100,000 women each year,' said Mr Harvey.
Overall, both incidence and mortality halved between the introduction of the National Cervical Screening Program in 1991 and 2002, however these reductions have not applied in equal measure to Aboriginal and Torres Strait Islander women.
For Aboriginal and Torres Strait Islander women, the rate of new cases of cervical cancer was twice that of non-Indigenous women, with death rates 4 times as high.
Cervical cancer cases and deaths in Australia remain very low by international standards.
Download Cervical screening in Australia 2012–2013
Triple threat—cardiovascular disease, diabetes and chronic kidney disease
 In 2011–12, more than 1 in 4 Australian adults had cardiovascular disease, diabetes, or chronic kidney disease.
This 'triple threat', which is detailed in Cardiovascular disease, diabetes and chronic kidney disease—Australian facts: prevalence and incidence, shows that 29% of Australian adults (4.9 million people) have at least one of these three diseases. About 7% (1.2 million people) had two, and 1% (182,000 people) had all three diseases.
Sushma Mathur, Head of the AIHW's Cardiovascular Disease, Diabetes and Kidney Unit said, 'Individually, cardiovascular disease is the most common of the three diseases, with 22% of Australian adults reporting that they had one or more cardiovascular diseases, including hypertensive disease, heart disease, stroke or heart failure'.
Around one-in-twenty Australian adults (5%) had diabetes (based on self-reported data and results of blood tests) and around one-in-ten (10%) showed signs of chronic kidney disease.
Alone and together
Cardiovascular disease and chronic kidney disease were often reported in those with diabetes, with 68% of people with diabetes having one or both of these diseases.
Among people with chronic kidney disease, more than half also had cardiovascular disease and/or diabetes.
'Cardiovascular disease, diabetes and chronic kidney disease often have similar underlying causes and features, and often share common risk factors, as well as prevention, management and treatment strategies', Ms Mathur said.
Some conditions remain under-diagnosed
While 917,000 people had diabetes (based on self-reported data and results of blood tests),1 in 5 of these did not self-report that they had the condition.
This suggests that for every 4 adults with diagnosed diabetes, there is approximately 1 with undiagnosed or unreported diabetes.
Similarly, while around 1.7 million adults showed signs of chronic kidney disease, only 1% of adults self-reported having the disease.
'This reflects the fact that chronic kidney disease remains a highly under-diagnosed condition, largely because by the time any symptoms appear, around 90% of kidney function can be lost', Ms Mathur said.
Age increases risk
The likelihood of having more than one condition increases with age, especially when one of the conditions was cardiovascular disease. For example, while only 2% of those aged 45–64 had both cardiovascular disease and chronic kidney disease, that increased to 15% of people aged 65 and over who had both diseases.
Australians living longer, with more years free of disability
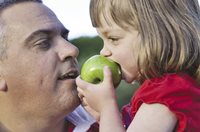 Australians can now expect to live longer lives with more years free of disability.
'Whether Australians have more years living free of disability as the overall life expectancy lengthens has important implications for population health and wellbeing, and for Australia's health and long term care systems', said report author Xing-yan Wen, of the Disability and Ageing Unit at the AIHW.
Between 1998 and 2012, male life expectancy at birth rose from 75.9 years to 79.9 years—a gain of 4 extra years. For females it rose from 81.5 years to 84.3 years—an extra 2.8 years. For males, disability-free life expectancy at birth rose by 4.4 years while for females it rose by 2.4 years.
'The gains in the number of expected years living free of disability were related to a combination of increasing longevity and decreases in disability prevalence rates', said Dr Wen.
Boys born in 2012 could expect to live to the age of 62.4 without disability and a further 17.5 years with some form of disability, while girls born in 2012 could expect to live to the age of 64.5 without disability and a further19.8 years with some form of disability.
Men who were 65 in 2012 could expect to live another 8.7 years without disability and a further 10.4 years with some form of disability, including 3.7 years with a severe or profound core activity limitation—that is, sometimes or always needing personal help with activities of self-care, mobility or communication.
Women who were 65 in 2012 could expect to live 9.5 years without disability and a further 12.5 years with some form of disability, including 5.8 years with a severe or profound core activity limitation.
While women can still expect to live longer than men, gender gaps in life expectancy and years living free of disability are narrowing across all age groups.
Between 1998 and 2012, the gap between males and females for years free of disability approximately halved, from 4.1 years to 2.1 years.
Download Healthy life expectancy in Australia: patterns and trends 1998 to 2012
Football and fractures—which sports are more likely to land you in hospital and why
 Injuries resulting from playing various codes of football make up the largest proportion of sports-related injuries requiring hospitalisation (about a third). However, when you add in motor sports and water sports you have the activities that result in almost half (47%) of all sports injury hospitalisations in Australia.
This information comes from an AIHW report on sports injury hospitalisations which shows that in 2011–12, around 36,000 people (aged 15 and over) were hospitalised due to an injury sustained while playing sport, and spent a total of 79,000 days in hospital.
Professor James Harrison, from the AIHW's National Injury Surveillance Unit in Adelaide, said 'Australian Rules football and soccer had the highest rates of injury hospitalisation, with 18 and 17 cases per 100,000 Australians, respectively'.
'While these sports had the highest population-based rates, when looking at rates based on the number of participants in a particular sport, wheeled motor sports—such as motorcycling and go-carting—had the highest rate,' Professor Harrison said. 'This group of sports had a rate of 3,570 hospitalisations per 100,000 participants.'
This was followed by roller sports (such as roller skating and skateboarding), with a rate of 2,310 hospitalisations per 100,000 participants.
Australian Rules football and Rugby had high hospitalisation rates based on the number of participants, with 1,320 and 1,290 hospitalisations per 100,000 participants, respectively.
Injury severity varied by sport, with cycling, motor sports and equestrian activities—all having a particularly high proportion of more severe injuries, with about one-quarter of cases considered to be life-threatening.
Injuries resulting from participation in wheeled motor sports had an average hospital stay of 3.5 days and accounted for the highest number of days (over 9,500 days) spent by patients in hospital.
Around two thirds of those admitted to hospital were aged under 35 and over three quarters were men.
In all but two sports (netball and fishing), the most common diagnosis was a fracture with the most commonly affected bones being the knee and lower leg.
Download Australian sports injury hospitalisations 2011–12
Falling rates of young people in detention in Australia
 The AIHW's most recent report on the youth detention population in Australia takes an in-depth look at the numbers and rates of young people in sentenced and unsentenced detention due to their involvement or alleged involvement in criminal activity.
Youth detention population in Australia 2014 shows that from June 2010 to June 2014, the rates of young people (aged 17 years and younger) in sentenced detention has continued to drop, while the number of young people in unsentenced detention has remained relatively stable.
Tim Beard, AIHW spokesperson said, 'during this four year period there was a drop from 1,053 to 929 young people in detention on any given night across Australia, which indicates a slight downward trend.'
Rates of young people aged 10–17 fell from 3.7 to 3.3 per 10,000 on an average night. This equates to around 1 in every 3,000 young people aged 10–17 across Australia.
'The reason for this drop was largely due to a fall in the rates of sentenced detention', Mr Beard said.
About half (52%) of young people in detention were unsentenced; that is, awaiting sentencing or the outcome of their court matter.
Rates of young people in detention on an average night dropped in New South Wales, Victoria, Western Australia, Tasmania and the Australian Capital Territory. The rates remained relatively stable in South Australia and the Northern Territory and rose in Queensland.
Indigenous young people in detention continue to be over-represented. About half (52%) of young people in detention on an average night were Indigenous.
Over the four-year period the rate rose from 22 times to 25 times the rate of non-Indigenous young people, with the increase largely attributed to the falling rate of non-Indigenous young people in detention.
Download Youth detention population in Australia 2014
New releases
National Bowel Cancer Screening Program: monitoring report 2013–14
This report presents statistics on the National Bowel Cancer Screening Program for Australians invited to take part between July 2013 and June 2014. Thirty-six per cent (about 510,000) of those who were invited went on to participate in screening, of whom 7.5% (37,700) were found to require further assessment. One out of every 11 assessments detected an advanced adenoma (pre-cancerous lesion), and a bowel cancer was detected in 1 out of every 25 assessments.
Published 22 June 2015
Download National Bowel Cancer Screening Program: monitoring report 2013–14
Maternal deaths in Australia 2008–2012
This report provides information on women who die in association with pregnancy and childbirth.
In 2008–2012, there were 105 maternal deaths in Australia that occurred within 42 days of the end of pregnancy, representing a maternal mortality ratio of 7.1 deaths per 100,000 women who gave birth. Maternal death in Australia is a rare event in the context of worldwide maternal deaths.
Published 10 June 2015
Download Maternal deaths in Australia 2008–2012
Exploring transitions between homelessness and public housing: 1 July 2011 to 30 June 2013
This report linked homelessness services and public housing data in order to better understand the clients of both. The report showed that specialist homelessness agencies were very successful in assisting clients to sustain their public housing tenancies. Most of those assisted into public housing were women, with the largest group represented by women and their children experiencing family and domestic violence.
Published 13 May 2015
Download Exploring transitions between homelessness and public housing: 1 July 2011 to 30 June 2013
Child protection Australia 2013–14
This is the Institute's eighteenth annual report on child protection in Australia. It showed that 143,023 children received child protection services in 2013–14, equating to 1 in 37 children receiving child protection services, with 73% being repeat clients. The report also indicated that Aboriginal and Torres Strait Islander children continue to be over-represented and are some 7 times as likely as non-Indigenous children to be receiving child protection services.
Published 8 May 2015
Download Child protection Australia 2013–14
Alcohol and other drug treatment services
This online report showed that over the 5 years to 2013–14, the percentage of people who were aged 40 and over, who were receiving treatment through a publicly-funded alcohol and other drug treatment service, rose from 30% to 33%, while those aged 20–29 fell from 29% to 27%. Two-thirds of all clients receiving treatment were male, and Indigenous Australians continue to be over- represented—14% of clients were Indigenous Australians, despite only comprising around 3% of the general population. Around 40% of closed (completed or ceased) treatment episodes were for alcohol as the main drug of concern, 24% were for cannabis, 17% for amphetamines.
Published 24 April 2015
Download Alcohol and other drug treatment services in Australia 2013-14
Australian Burden of Disease Study: fatal burden of disease in Aboriginal and Torres Strait Islander people 2010
This is the second report in the Australian Burden of Disease Study series. It provides estimates of fatal burden for 2010 for the Aboriginal and Torres Strait Islander population as well as estimates of the gap in fatal burden between Indigenous and non-Indigenous Australians. It showed that in 2010, the rate of fatal burden experienced by Indigenous Australians was 2.6 times the rate of fatal burden experienced by non-Indigenous Australians. The report also showed that injuries and cardiovascular diseases contributed the most fatal burden for Indigenous Australians (22% and 21% respectively), followed by cancer (17%).
Published 10 April 2015
Download Australian Burden of Disease Study: fatal burden of disease in Aboriginal and Torres Strait Islander people 2010
Use of aged care services before death
This bulletin examines people's use of aged care services in the 8 years before death, using the cohort of 116,481 people who died in 2010–11 aged at least 65. It showed that overall, 80% of these people had used aged care in the 8 years before death, and three-fifths were aged care clients when they died. Just under half of the cohort began using aged care more than 4 years before their death.
Published 18 March 2015
Download Use of aged care services before death