The age-standardised rate of dementia deaths in the first 10 months of 2020 was similar or lower than previous years
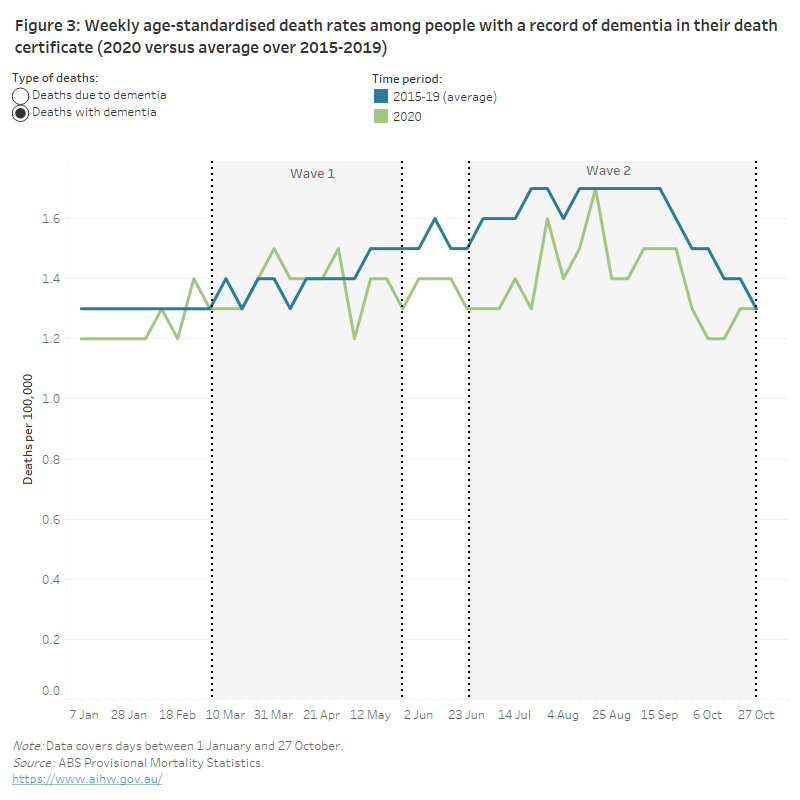
Figure 3 shows weekly trends in the age-standardised death rates among people with dementia recorded on their death certificates in 2020 compared to the average age-standardised death rates for 2015–2019.
Examination of the age-standardised death rate for the first 10 months of 2020 (by adding up weekly rates) suggests that the COVID-19 pandemic in Australia did not lead to an increase in dementia mortality compared with previous years:
- the overall death rate due to dementia, that is where dementia was the underlying cause of death, was similar in the first 10 months of 2020 to the average rate over the same months during 2015–19 (33 and 34 deaths per 100,000 population, respectively)
- the death rate with dementia, that is, where dementia was recorded as the underlying and/or and associated cause of death, was slightly lower over the first 10 months of 2020 compared to the average rate over the same months during 2015–19 (58 and 63 deaths per 100,000 population, respectively).
There was however a notable difference in the age-standardised death rates due to dementia by pandemic waves:
- during wave 1, the death rate due to dementia was similar to the average rate for 2015–19 in the same period (10 per 100,000 population)
- during wave 2, the death rate due to dementia was lower than the average rate seen over the same period in previous years (15 versus 17 deaths per 100,000 population). Wave 2 included the winter months and historically, dementia mortality shows a seasonal pattern with higher mortality rates during these months, likely due to an increased number of respiratory infections during winter (ABS 2020a)
- within each pandemic wave, there were weekly variations in the death rates due to and with dementia; these may be due to natural variations in deaths, be related to the impact of the pandemic, or to other factors, but we are unable to untangle what is driving these variations due to limitations in our data.