Dental care
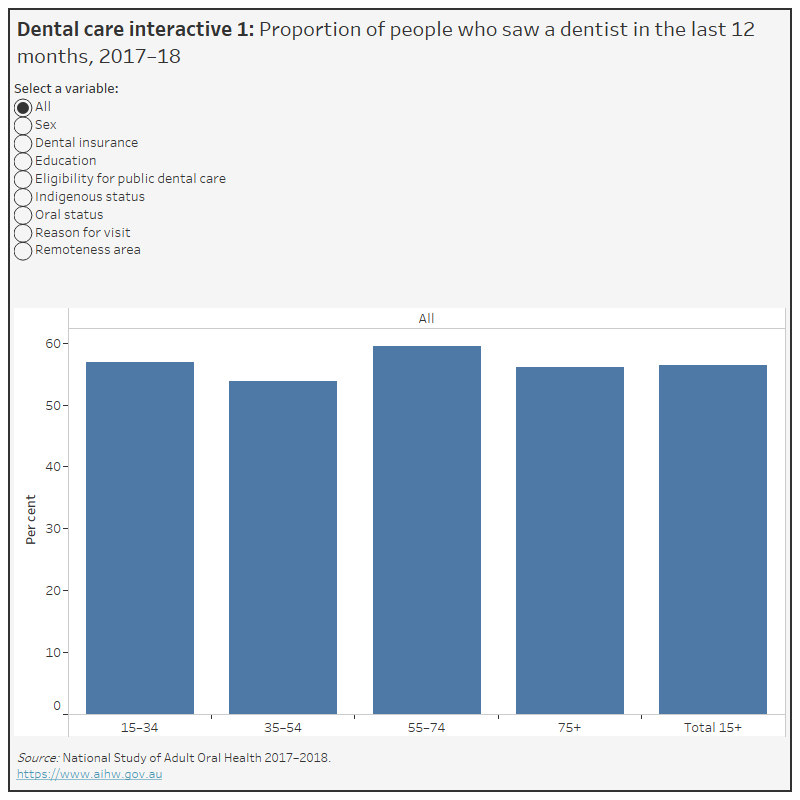
Dental care – Interactive 1
This figure shows the proportion of adults aged 15 years and over who visited a dentist in the last 12 months, by selected characteristics. National data is presented for 2017–18. In 2017–18, 56.4% of adults aged 15 years and over saw a dentist in the last 12 months.
Dental care – Interactive 2
This figure shows the proportion of adults aged 15 years and over whose last dental visit was 5 or more years ago, by selected characteristics. National data is presented for 2017–18. In 2017–18, 11.4% of people had their last dental visit 5 or more years ago.
Dental care – Interactive 3
This figure shows the proportion of adults aged 15 years and over who usually visit a dental professional at least once a year, by selected characteristics. National data is presented for 2017–18. In 2017–18, 57.5% of adults aged 15 years and over usually visited a dental professional at least once a year.
Dental care – Interactive 4
This figure shows dental visiting patterns in the Australian population, by age groups. National data is presented for 2017–18. In 2017–18, 89.4% of adults aged 15 years and over paid for their last dental visit and 78.5% of adults aged 15 years and over have a dentist which they usually visit.
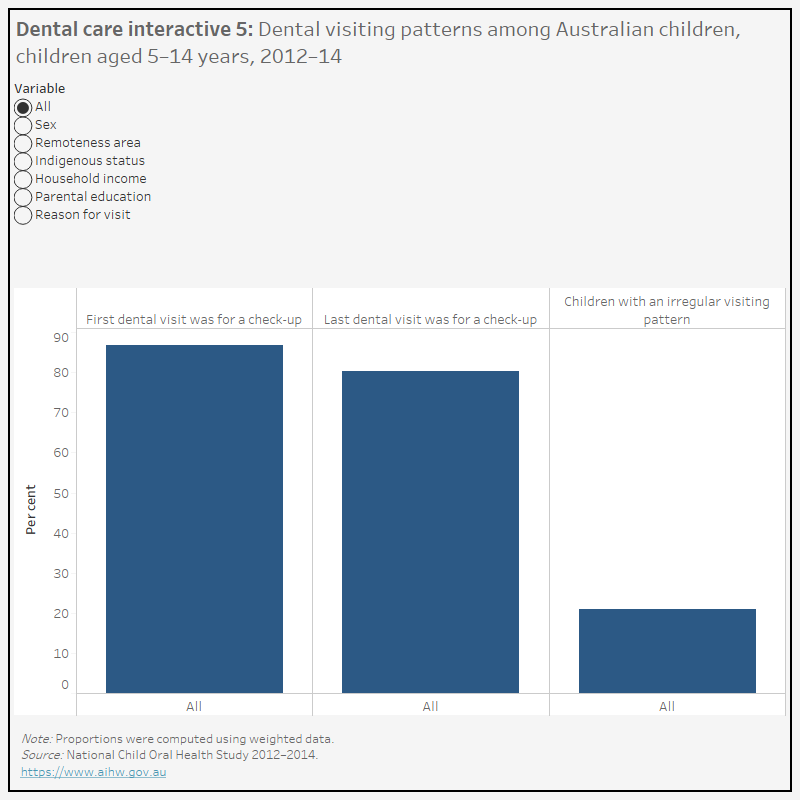
Dental care – Interactive 5
This figure shows dental attendance patterns among Australian children aged 5–14 years, by selected characteristics. National data is presented for 2012–14. In 2012–14, 86.7% of Australian children aged 5–14 years had their first dental visit for a check-up and 80.2% had their last dental visit for a check-up.
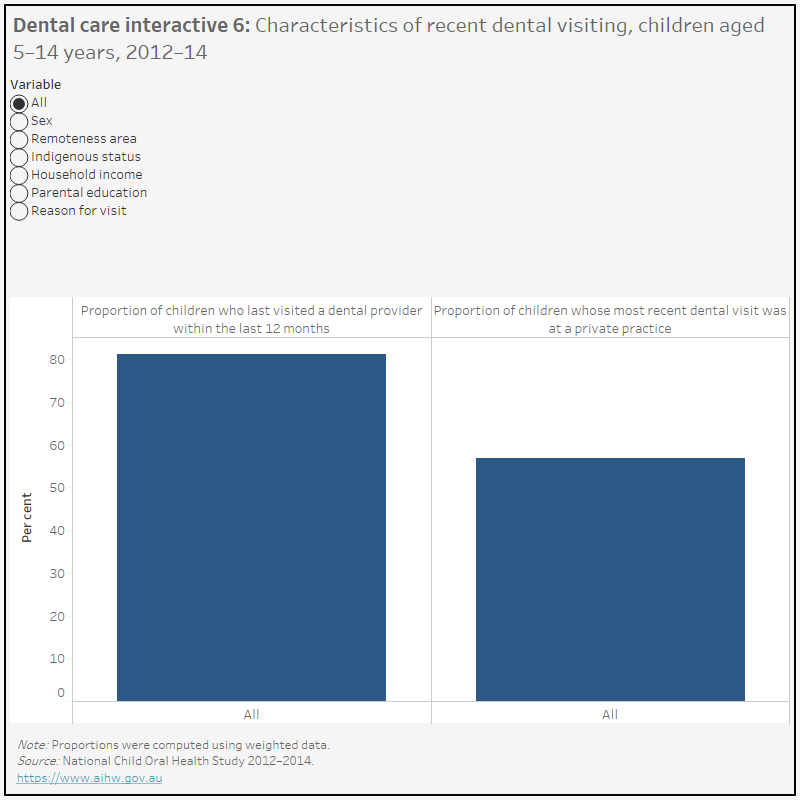
Dental care – Interactive 6
This figure shows the proportion of Australian children aged 5–14 years who last visited a dental provider within the last 12 months and whose most recent dental visit was at a private practice, by selected characteristics. National data is presented for 2012–14. In 2012–14, 56.8% of Australian children aged 5–14 years had their most recent dental visit at a private practice.
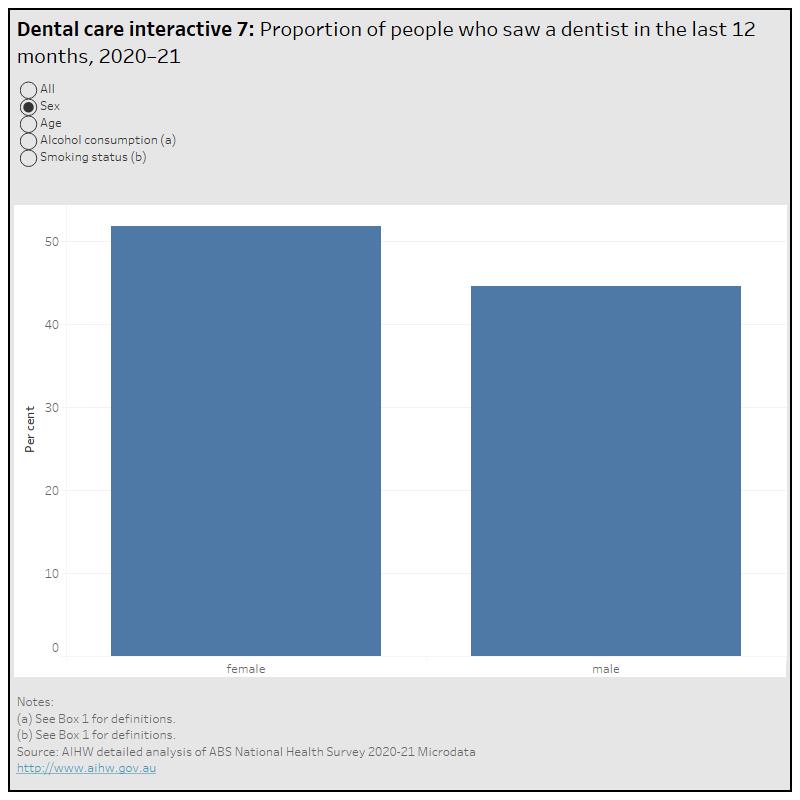
Dental care – Interactive 7
This figure shows the proportion of people who saw a dentist in the last 12 months, by selected characteristics. National, state and territory data is presented for 2020–21. In 2020–21, 51.7% of females and 44.6% of males saw a dentist in the last 12 months.
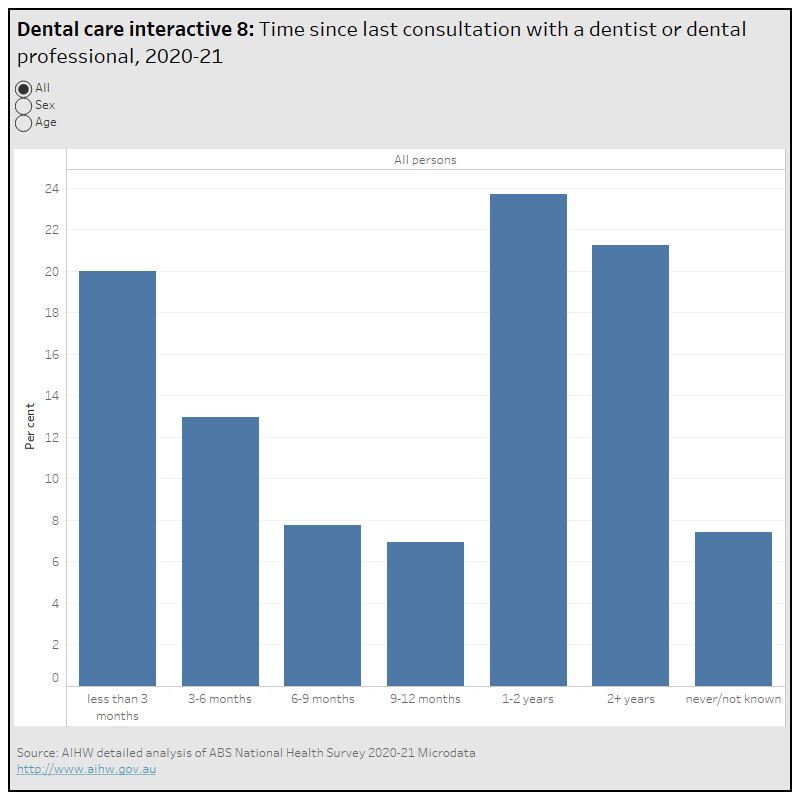
Dental care – Interactive 8
This figure shows the time since last consultation with a dentist or dental professional, by sex and age. National data is presented for 2020–21. In 2020–21, 21.2% of people had seen a dentist or dental professional more than 2 years ago.
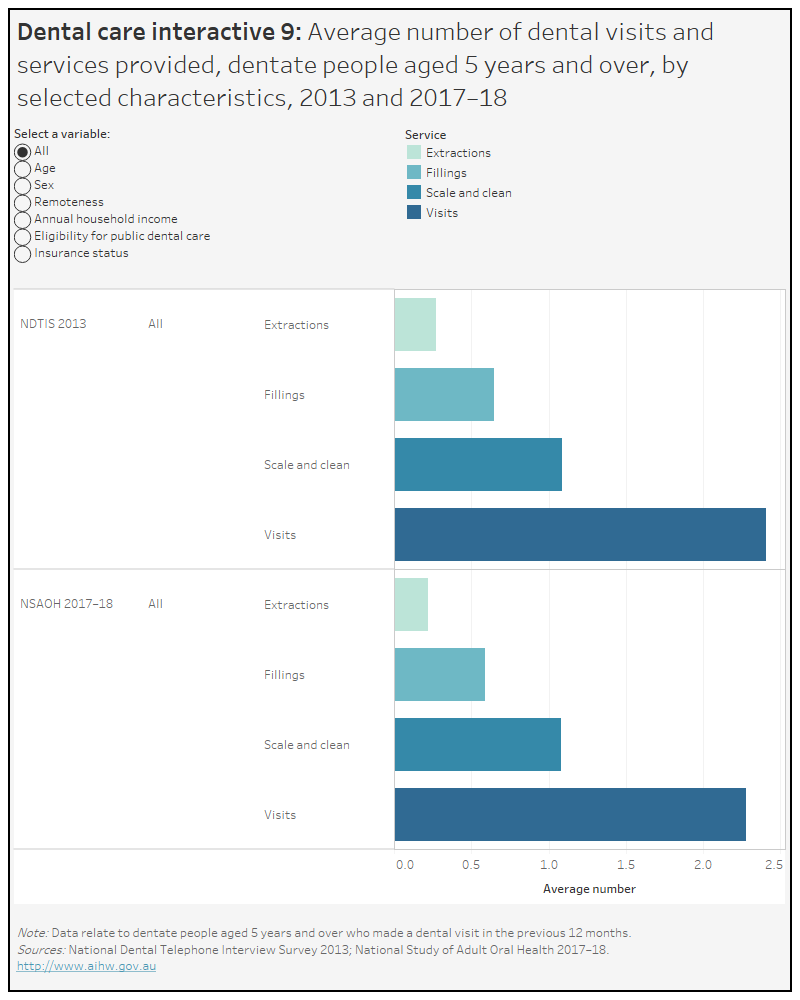
Dental care – Interactive 9
This figure shows the average number of dental visits and services provided for people aged 5 years and over, by selected characteristics. National data is presented for 2013 and 2017–18. In 2017-18, people aged 5 years and over made an average of 2.28 visits.
Dental care – Interactive 10
This figure shows the reason for last visit, practice type at last visit and visiting patterns, by selected characteristics. National data is presented for 2013 and 2017-18. In 2017-18, dental visiting varied by household income; people from low income households (<$30,000) were more likely to visit for a problem (50.9%) whereas people from high income households (>$140,000) were more likely to visit for a check-up (75.4%).
Dental care – Interactive 11
This figure shows the dental practitioner visiting trends for adults aged 18 years. National data is presented for 1999 to 2017-18. Between 1999 and 2017-18, the proportion of adults with favourable visiting patterns fluctuated but increased overall from 36.3% in 1999 to 43.6% in 2017-18.
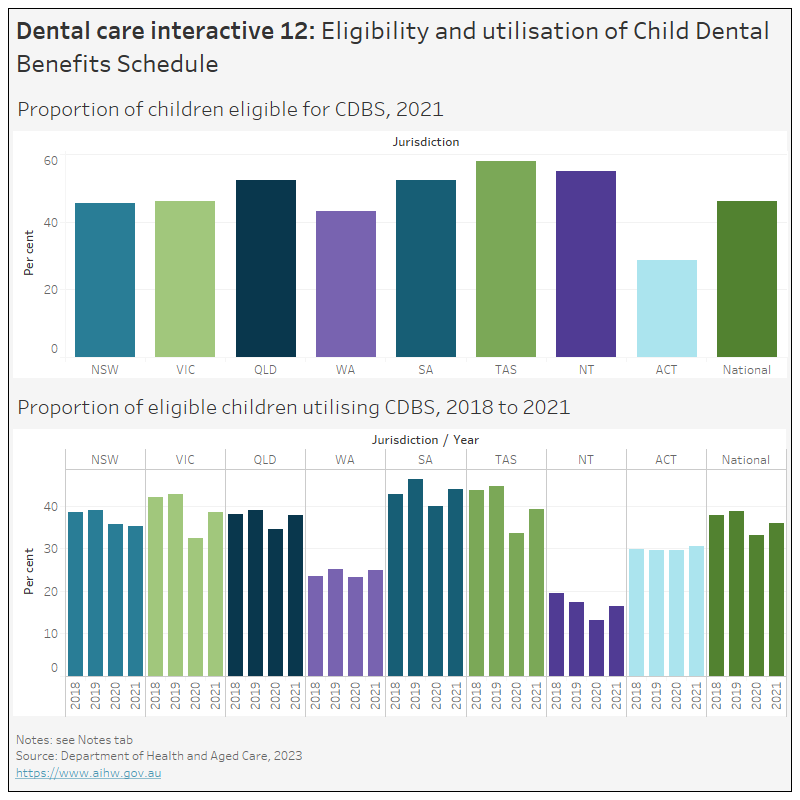
Dental care – Interactive 12
This figure shows the proportion of children eligible for services provided under the Child Dental Benefits Schedule in 2021. It also shows the proportion of eligible children utilising the Child Dental Benefits Schedule for each year between 2018 and 2021. National, state and territory data is presented.
Dental care – Interactive 13
This figure shows the average benefit paid per service under the Child Dental Benefits Schedule (CDBS), by type of service and sub-group. National data is presented for 2014–2022. In 2022, the average benefit paid per service under the CDBS was $60.
Dental care – Interactive 14
This figure shows the services and benefits per 100,000 population under the Child Dental Benefits Schedule, by type of service and sub-group. National, state and territory data is presented for 2014–2022.
Dental care – Interactive 15
This figure shows the impact of COVID-19 on the provision of Child Dental Benefits Schedule services. State and territory data is presented for 2018-2022.
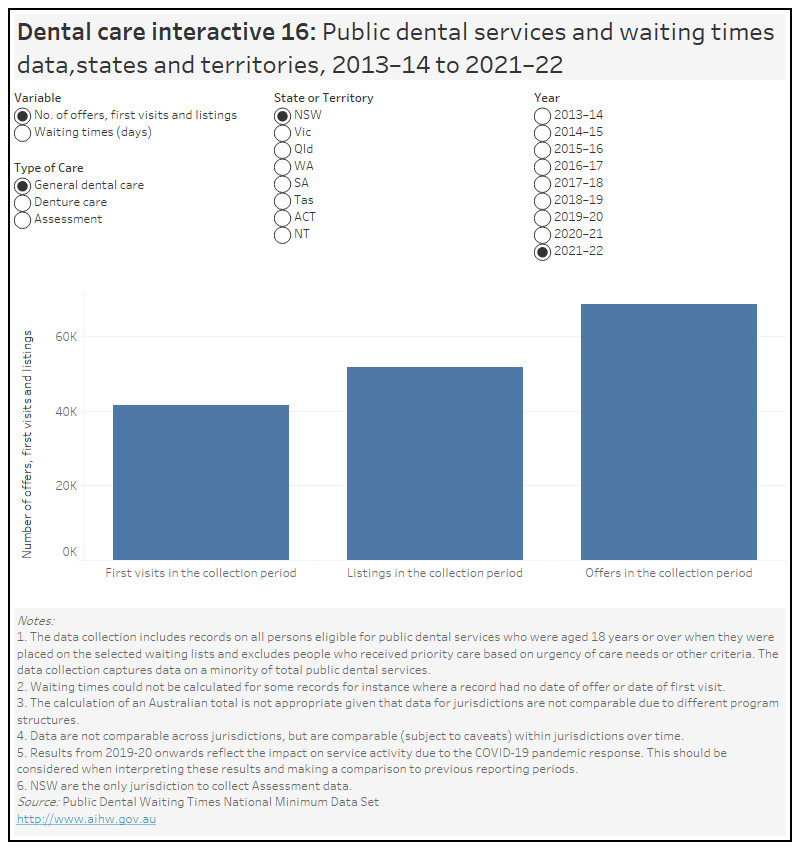
Dental care – Interactive 16
This figure shows the public dental services and waiting times data, by type of care. State and territory data is presented for 2013–14 to 2021–22.