Patient experience

Data presented in this section were sourced from the Australian Bureau of Statistics (ABS) Patient Experience Survey (ABS Patient Experience Survey, various). Patient experience surveys obtain patients’ views and observations on aspects of health care services they have received. This includes their views on the accessibility of services and the physical environment, and aspects of the patient-clinician interaction.

This kind of information can be very useful for health services and others who are interested in driving continuous improvement in health services. Australia’s National Oral Health Plan 2015–2024 (COAG 2015) is underpinned by four guiding principles, including that services be accessible to all who need them, with respect for individuals needs and views.

Key terms

  • Dental professional: Includes dentists, dental hygienists and dental specialists such as periodontists, orthodontists and oral and maxillofacial surgeons.
  • Index of Relative Socio-economic Disadvantage: This is one of four Socio-Economic Indexes for Areas (SEIFAs) complied by the ABS following each Census of Population and Housing. This index summarises attributes such as low income, low educational attainment, unemployment, jobs in relatively unskilled occupations and dwellings without motor vehicles. The first (or lowest) quintile refers to the most disadvantaged areas, while the fifth (or highest) quintile refers to the least disadvantaged areas.
  • Long term health condition: A condition that has lasted or is likely to last six months or more.
  • Self-assessed health: A person’s impression of their own health against a five-point scale from excellent through to poor.

Use of dental services

In 2021–22, around 1 in 2 (49%) Australians aged 15 years and over reported seeing a dental professional in the last 12 months

  • The proportion of adults aged 15 years and over who saw a dental professional in the last 12 months remained relatively stable throughout the period 2011–12 to 2021–22, at around half of all adults.

In 2021–22:

  • more females (53%) than males (46%) saw a dental professional
  • people who self-assessed their health as fair/poor (46%) were less likely to have seen a dental professional than those who self-assessed their health as excellent/very good/good (50%)
  •  people living in areas of least socio-economic disadvantage (59%) were more likely to have seen a dental professional than those living in areas of most disadvantage (38%)
  • people living in Major cities (51%) were more likely to have seen a dental professional than those living in Inner regional (45%) areas or Outer regional, Remote and very remote areas (43%).

Explore the data using the Patient experience interactive 1 below.

Patient experience – Interactive 1

This figure shows the use of dental services in the last 12 months, by selected characteristics. National data is presented for 2021–22. This figure also shows the use of dental services in the last 12 months, by year. National data is presented for 2011–12 to 2021–22. In 2021–22, 49.4% of people used dental services in the last 12 months.

Need for dental services

Each year, around 6 in 10 Australians aged 15 years and over reported needing to see a dental professional in the last 12 months (2011–12 to 2021–22)

In 2021–22, 60% of Australians aged 15 years and over reported that they needed to see a dental professional in the last 12 months. Most people who needed to, saw a dental professional (83%), with nearly half of those seeing a dental professional 2 or more times (45%).

Explore the data using the Patient experience interactive 2 below.

Patient experience – Interactive 2

This figure shows the need for dental services in the last 12 months. National data is presented for 2011–12 to 2021–22. In Australia, 59.6% of people needed to see a dental professional in 2021–22. Of those who needed to see a dental professional, 83% saw a dental professional in 2021–22.

See Data tables: Patient experience for data tables.

In 2021–22, females (64%) were more likely than males (55%) to have reported needing to see a dental professional in the last 12 months

In 2021–22:

  • people aged 55–64 years (64%) were more likely to have needed to see a dental professional than any other age group
  • people living in Major cities (61%) were more likely to have needed to see a dental professional than those living in Inner regional (57%) and Outer regional, Remote and very remote areas (55%)
  • people living in areas of least disadvantage (68%) were more likely to have needed to see a dental professional than those living in areas of most disadvantage (52%)
  • people with long-term health conditions (63%) were more likely to have needed to see a dental professional than those without long-term health conditions (56%).

Explore the data using the Patient experience interactive 3 below.

Patient experience – Interactive 3

This figure shows the proportion of adults aged 15 years and over who either needed or did not need to see a dental professional in the last 12 months, by selected characteristics. National data is presented for 2017–18 to 2021–22. In 2021–22, 55.1% of males and 64% of females needed to see a dental professional in the last 12 months.

See Data tables: Patient experience for data tables.

In 2021–22, people living in areas of most disadvantage (22%) were more likely to report that they needed to see a dental professional but did not than those living in areas of least disadvantage (10%)

In 2021–22:

  • people aged 25–34 years (24%) were more likely to have needed to but not seen a dental professional than any other age group
  • people living in Major cities (84%) were more likely to have needed to and have seen a dental professional than those living in Inner regional (80%) and Outer regional, Remote and very remote (77%) areas.
  • people who self-assessed their health as excellent/very good/good (84%) were more likely to have needed to and seen a dental professional than those who self-assessed their health as fair/poor (77%).

Explore the data using the Patient experience interactive 4 below.

Patient experience – Interactive 4

This figure shows the proportion of adults aged 15 years and over who needed to and either saw or did not see a dental professional in the last 12 months, by selected characteristics. National data is presented for 2017–18 to 2021–22. In 2021–22, 83% of people who needed to saw a dental professional in the last 12 months.

See Data tables: Patient experience for data tables.

Experience of dental services

In 2021–22, around 9 in 10 (90%) adults aged 15 years and over thought their dental professional always showed respect

Adults aged 15 years and over were asked about their experience with dental professionals who they had seen in the last 12 months. In 2021–22:

  • around 9 in 10 (90%) thought their dental professional always spent enough time with them
  • most thought their dental professional always listened carefully (87%)
  • around 1 in 10 (10%) received public dental care
  • around 1 in 6 (16%) delayed or did not see a dental professional when needed due to cost.

Explore the data using the Patient experience interactive 5 below.

Patient experience – Interactive 5

This figure shows the experiences of adults aged 15 years and over who needed to and saw a dental professional in the last 12 months, by selected characteristics. National data is presented for 2017–18 to 2021–22. In 2021–22, 34% of females and 31% of males at least once delayed seeing or did not see a dental professional when needed.

See Data tables: Patient experience for data tables.

Impact of COVID-19 on dental visiting

The COVID-19 pandemic has impacted every aspect of the Australian health system, including the provision of dental care services (refer to Impact of COVID-19 on dental services for more detail).

In 2020–21, around 1 in 8 (12%) adults aged 15 years and over delayed seeing or did not see a dental professional at least once in the last 12 months due to COVID-19

In 2020–21, the proportion of adults aged 15 years and over who delayed seeing or did not see a dental professional in the last 12 months due to COVID-19 was:

  • higher for females (14%) than males (9.4%)
  • higher for those people living in Major cities (13%) than those living in Inner regional (9.8%) or Outer regional, remote or very remote areas (7.4%)
  • higher for those who self-assessed their health as fair/poor (15%) than those who self-assessed their health as excellent/very good/good (12%)
  • higher for those people with a long-term health condition (14%) than those without a long-term health condition (11%).

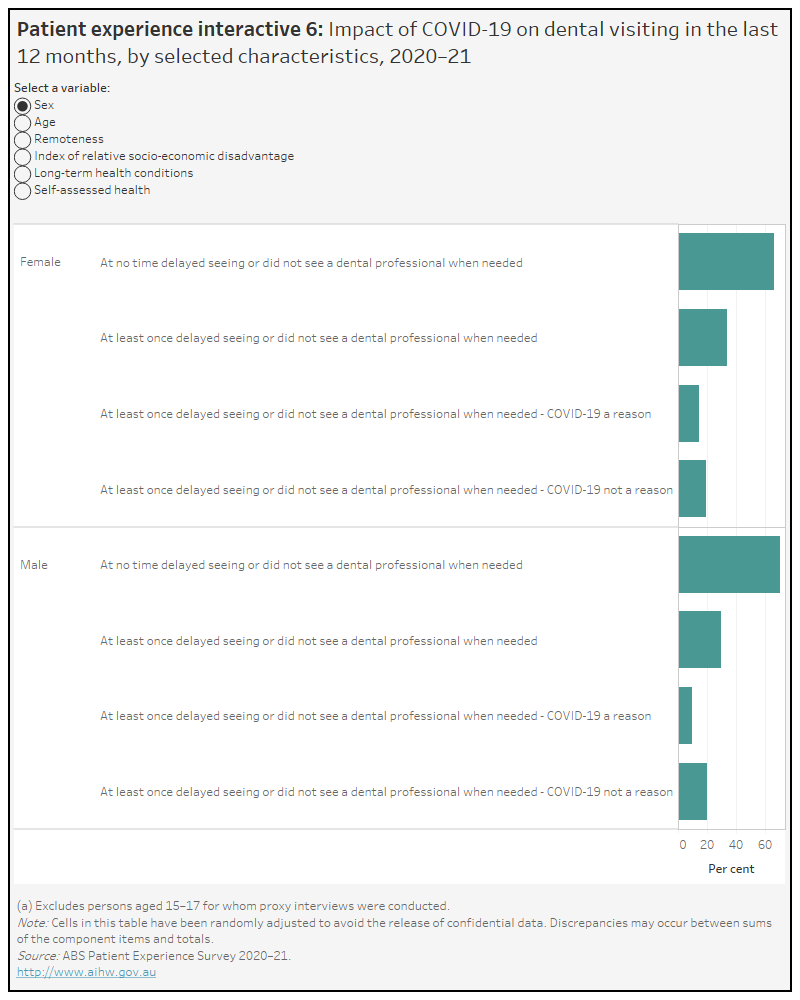
Patient experience – Interactive 6

This figure shows the impact of COVID-19 on dental visiting in the last 12 months, by selected characteristics. National data for 2020-21 is presented. In 2020-21, 12.2 of adults aged 15 years and over at least once delayed seeing or did not see a dental professional due to COVID-19.

See Data tables: Patient experience for data tables.