Aboriginal and Torres Strait Islander Australians

Many Aboriginal and Torres Strait Islander people experience poor oral health such as multiple caries and untreated dental disease, and are less likely to have received preventive dental care (AHMAC 2017). The oral health status of Indigenous Australians, like all Australians, is influenced by many factors (see What contributes to poor oral health?) and a tendency towards unfavourable (refer to Key terms below) dental visiting patterns, broadly associated with accessibility, cost and a lack of cultural awareness by some service providers (COAG 2015; NACDH 2012).

Key terms

  • Deciduous teeth: Primary or ‘baby’ teeth that erupt (that is, become visible in the mouth) during infancy. A child usually has 20 deciduous teeth.     
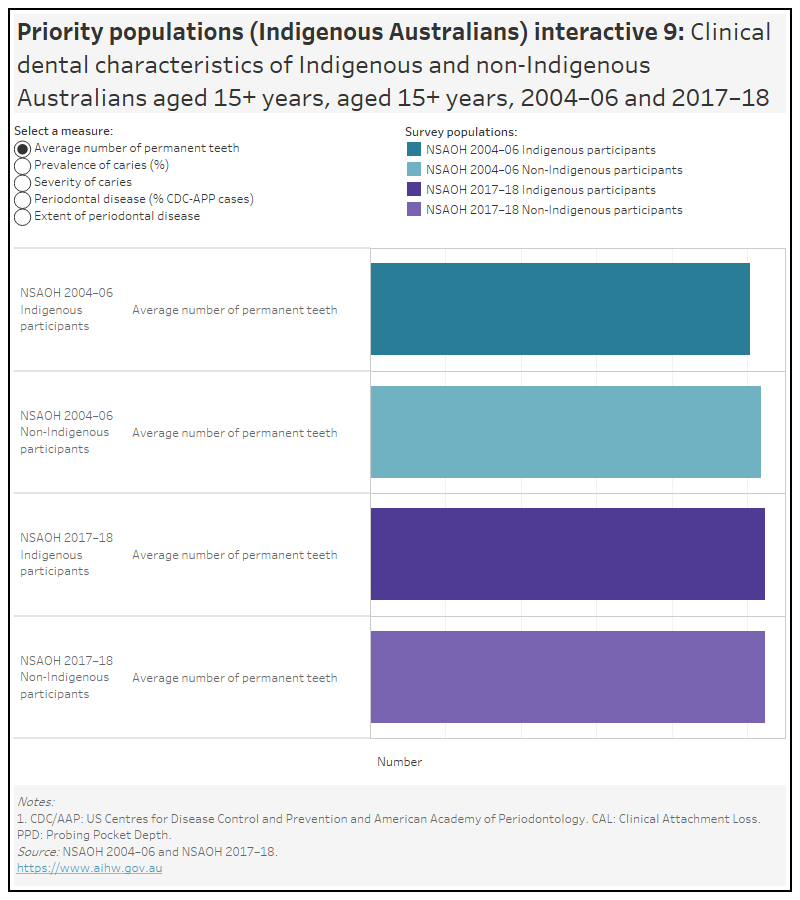
  • Permanent teeth: Secondary or ‘adult’ teeth that start to erupt at around 6 years of age. A person usually has 32 permanent teeth.
  • Dental caries: A disease process that can lead to cavities (small holes) in the tooth structure that compromise both the structure and the health of the tooth, commonly known as tooth decay. 
  • The dmfs and DMFS score: A score that counts the number of tooth surfaces that are decayed (d), missing due to caries (m) or filled because of caries (f)— ‘dmfs’ refers to deciduous teeth, ‘DMFS’ refers to permanent teeth. Each tooth was divided into five surfaces and each surface decayed or filled was counted, but each missing tooth was counted as three surfaces. Untreated decay was defined as a cavity in the surface enamel caused by the caries process, a missing surface if the tooth had been extracted because of decay and a filled surface when the filling had been placed due to decay.
  • Favourable dental visiting pattern: Visiting a dentist once or more a year (usually for a check-up) and having a usual dental provider.
  • Unfavourable dental visiting pattern: Visiting less than once every two years (usually for a problem), or visiting once every two years (usually for a problem) and without a regular dental provider.
  • Intermediate dental visiting pattern: Visiting classified as neither favourable or unfavourable.

Aboriginal and Torres Strait Islander Health Performance Framework 2020 web report

Since 2006, Aboriginal and Torres Strait Islander Health Performance Framework (HPF) reports have provided information about Indigenous Australians’ health outcomes, key drivers of health and the performance of the health system. The HPF was designed, in consultation with Aboriginal and Torres Strait Islander stakeholder groups, to promote accountability, inform policy and research, and foster informed debate about Indigenous Australians’ health.

The Aboriginal and Torres Strait Islander Health Performance Framework 2020 web report reports on 68 measures across three domains (tiers). Measure 1.11 Oral health in Tier 1—Health status and outcomes describes the oral health of Aboriginal and Torres Strait Islander people. Data from the 2018–19 National Aboriginal and Torres Strait Islander Health Survey shows that:

  • 58% of Aboriginal and Torres Strait Islander children aged 0–14 had seen a dentist in the last 12 months
  • an estimated 19% of Indigenous Australians reported that they did not go to a dentist when they needed to in the previous 12 months. Reasons included: cost (42%), too busy (24%), disliking service or professional, or feeling embarrassed or afraid (22%) and waiting time too long or not available at time required (15%)
  • 6% of Indigenous Australians aged 15 and over were reported to have complete tooth loss and 45% had lost at least one tooth.

Oral health outreach services for Aboriginal and Torres Strait Islander children in the Northern Territory, July 2012 to December 2022

Oral health is an important component of overall health and quality of life. Poor oral health can affect adults and children alike, causing pain, embarrassment, and even social marginalisation. For children, the effects can be long term, and carry through to adulthood.

Aboriginal and Torres Strait Islander (First Nations) children are more likely than non-Indigenous children to experience tooth decay. Several factors contribute towards the poorer oral health of First Nations children, including social disadvantage and lack of access to appropriate diet and dental services.

Since 2007, the Australian Government has helped fund oral health services for First Nations children aged under 16 in the Northern Territory. The Northern Territory Remote Aboriginal Investment Oral Health Program (NTRAI OHP) complements the Northern Territory Government Child Oral Health Program, by providing preventive (application of full-mouth fluoride varnish and fissure sealants) and clinical (tooth extractions, diagnostics, restorations and examinations) services.

The Oral health outreach services for Aboriginal and Torres Strait Islander children in the Northern Territory, July 2012 to December 2022 presents data from the NTRAI OHP (AIHW 2023).

How many First Nations children received services in the NTRAI OHP?

In 2022, full-mouth fluoride varnish services, fissure sealant applications and clinical service visits were provided to First Nations children in the Northern Territory under the NTRAI OHP. Of those children:

  • 5,338 children received 6,603 full-mouth fluoride varnish services, an increase of 181 services from 2021
  • 1,236 children received fissure sealant applications to 5,498 teeth during 1,346 services, an increase of 237 teeth from 2021
  • 4,774 children received clinical services during 7,505 visits—such as dental assessments, fillings, extractions, or preventive services—more than twice as many visits as in 2021. This excludes 1,073 visits where only full-mouth fluoride varnish and/or fissure sealant services were provided.  

Australian Indigenous children’s oral health status and use of dental care services

Data in the following sections were sourced from the National Child Oral Health Study 2012–14 (NCOHS) (Do & Spencer 2016). The NCOHS is a population-based survey which provides information on the oral health of children aged 5–14 years, who reside in all Australian states and territories. Information is collected using interviews and standardised dental examinations. A total of 26,224 children from across Australia participated in the study. The most complete information about Australians’ oral health status and their use of dental services is available via national population surveys, although these are conducted infrequently, only around once every 10 years.

Oral health status of Australian Indigenous children

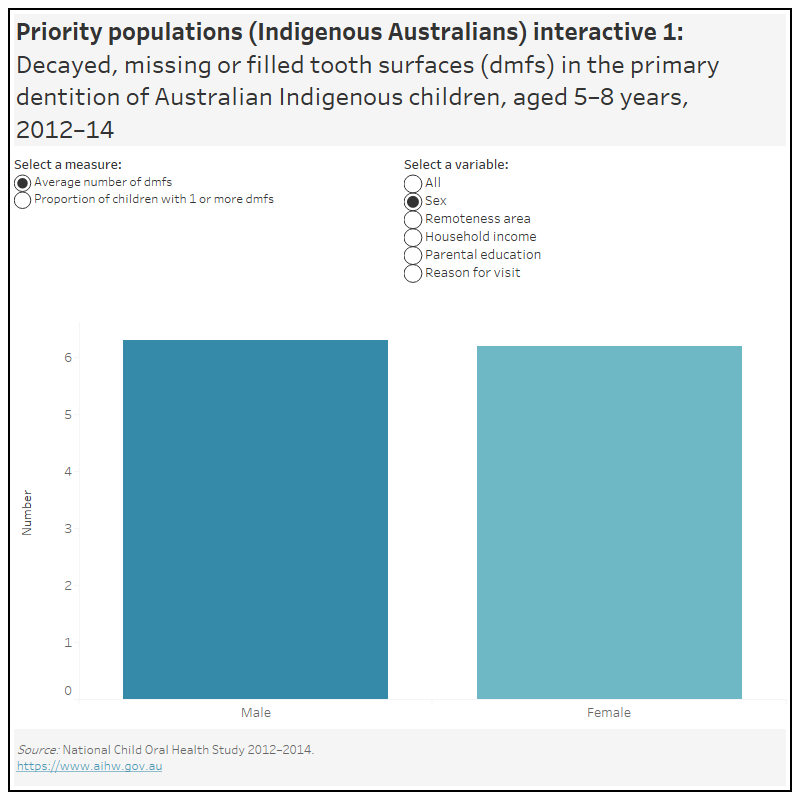
In 2012–14, Australian Indigenous children aged 5–8 years had an average number of 6.3 decayed, missing or filled tooth surfaces (dmfs) in the primary dentition

  • The average number of decayed, missing or filled surfaces among Indigenous children increased as household income decreased, ranging from 0.8 dmfs in high income households, 3.1 dmfs in medium income households and 8.1 dmfs in low income households.
  • Indigenous children of parents with school-level education had an average of 9.1 dmfs, whereas children of parents with vocational education had an average of 3.3 dmfs and children of parents with tertiary education had an average of 3.2 dmfs.
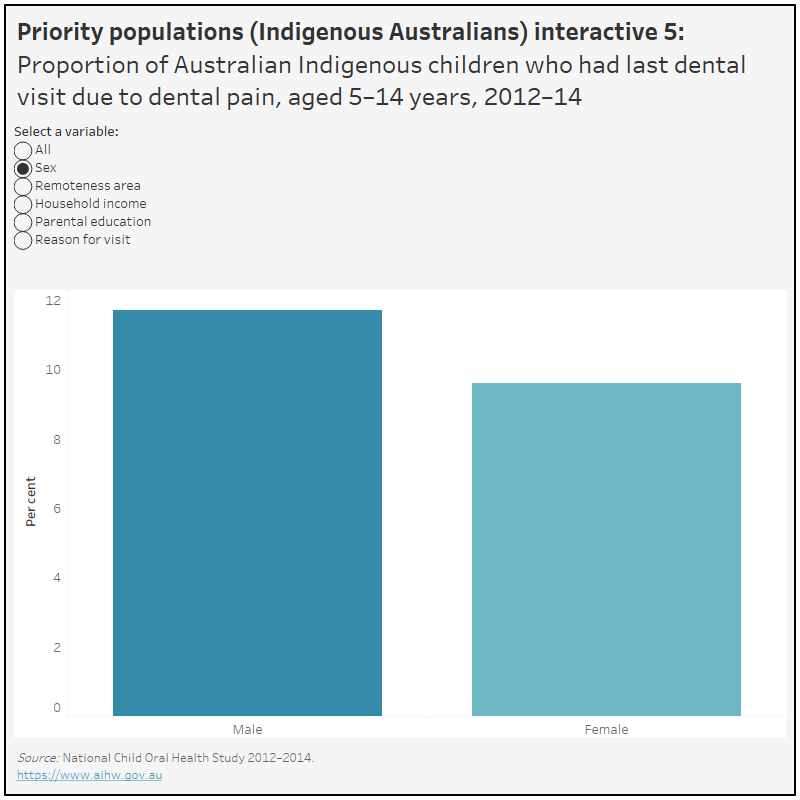
  • Indigenous children who last visited the dentist for a dental problem had an average number of 13.0 dmfs, whereas those who last visited for a check-up had an average of 4.6 dmfs.

Around 6 in 10 (59%) of Australian Indigenous children aged 5–8 years had at least one tooth surface with caries experience in the primary dentition

  • 57% of male and 62% of female Indigenous children had at least one tooth surface with caries experience in the primary dentition.
  • The majority (80%) of Indigenous children who last visited the dentist for a dental problem had at least one tooth surface with caries experience in the primary dentition.

Explore the data using the Priority populations (Indigenous Australians) interactive 1 below.

Priority populations (Indigenous Australians) – Interactive 1

This figure shows the average number decayed, missing or filled tooth surfaces (dmfs) in the primary dentition, among Australian Indigenous children aged 5–8 years, by selected characteristics. This figure also shows the proportion of Australian Indigenous children aged 5–8 years with 1 or more dmfs. National data is presented for 2012–14. In 2012–14, Australian Indigenous children aged 5–8 years had 6.3 dmfs and 59.4% had 1 or more dmfs.

In 2012–14, Australian Indigenous children aged 9–14 years had an average of 1.8 decayed, missing or filled tooth surfaces (DMFS) in the permanent dentition

  • Indigenous children of parents with school-level education had an average of 2.1 DMFS, whereas children of parents with vocational education had an average of 1.1 DMFS and children of parents with tertiary education had an average of 1.2 DMFS.
  • Indigenous children who last visited the dentist for a dental problem had an average of 2.1 DMFS, whereas those who last visited for a check-up had an average of 1.6 DMFS.

  • The average number of DMFS increased with remoteness area, ranging from 1.3 DMFS in Major cities, 1.7 DMFS in Inner regional areas, 2.4 DMFS in Outer regional areas and 2.5 DMFS in Remote and very remote areas.

Nearly half (46%) of all Australian Indigenous children aged 9–14 years had at least one tooth surface with caries experience in the permanent dentition


  • 48% of Indigenous children who last visited the dentist for a dental problem and 43% who last visited for a check-up had at least one tooth surface with caries experience in the permanent dentition.
  • The proportion of Indigenous children with at least one tooth surface with caries experience increased with remoteness area, ranging from 39% in Major cities, 48% in Inner regional and Outer regional areas to 59% in Remote and very remote areas.

Explore the data using the Priority populations (Indigenous Australians) interactive 2 below.

Priority populations (Indigenous Australians) – Interactive 2

This figure shows the average number decayed, missing or filled tooth surfaces (DMFS) in the permanent dentition among Australian Indigenous children aged 9–14 years, by selected characteristics. This figure also shows the proportion of Australian Indigenous children aged 9–14 years with 1 or more DMFS. National data is presented for 2012–14. In 2012–14, Australian Indigenous children aged 9–14 years had 1.8 DMFS and 46.2% had 1 or more DMFS.

Indigenous Australian children’s dental care

In 2012–14, around 8 in 10 (78%) Australian Indigenous children aged 5–14 years made their first dental visit for a check-up

  • Around 3 in 4 (75%) Indigenous children of parents with school-level education made their first dental visit for a check-up, as compared to 79% of children of parents with vocational education and 82% of children of parents with tertiary education.

In 2012–14, around 7 in 10 (69%) Australian Indigenous children aged 5–14 years made their most recent dental visit for a check-up

  • 64% of Indigenous children from low income households made their most recent dental visit for a check-up, compared with 77% from medium income households and 72% from high income households.

Explore the data using the Priority populations (Indigenous Australians) interactive 3 below.

Priority populations (Indigenous Australians) – Interactive 3

This figure shows dental attendance patterns among Australian Indigenous children aged 5–14 years, by selected characteristics. National data is presented for 2012–14. In 2012–14, for Australian Indigenous children aged 5–14 years, 77.6% had their first dental visit for a check-up and 68.8% had their last dental visit for a check-up.

In 2012–14, around 3 in 4 (75%) of Australian Indigenous children aged 5–14 years attended their last dental visit at a public clinic

  •  More Indigenous children from low income households (88%) attended their last dental visit at a public clinic than those from medium income households (60%) and those from high income households (49%).
  • More Indigenous children of parents with school-level education (83%) attended their last dental visit at a public clinic than children of parents with vocational education (74%) and children of parents with tertiary education (62%).

Explore the data using the Priority populations (Indigenous Australians) interactive 4 below.

Priority populations (Indigenous Australians) – Interactive 4

This figure shows the percentage of Australian Indigenous children aged 5–14 years whose most recent dental visit was at a public dental clinic, by selected characteristics. National data is presented for 2012–14. In 2012–14, 75.4% of Australian Indigenous children aged 5–14 years had their most recent dental visit at a public dental clinic.

In 2012–14, around 1 in 10 (10%) Australian Indigenous children aged 5–14 years attended their last dental visit due to dental pain

  • 15% of Indigenous children of parents with school-level education attended their last dental visit due to dental pain, compared to 8.1% of children of parents with vocational education and 6.3% of children of parents with tertiary education.
  • Around one-third (34%) of Indigenous children whose reason for their last dental visit was for a dental problem attended their last dental visit due to dental pain.

Explore the data using the Priority populations (Indigenous Australians) interactive 5 below.

Priority populations (Indigenous Australians) – Interactive 5

This figure shows the percentage of Australian Indigenous children aged 5–14 years who had their last dental visit due to dental pain, by selected characteristics. National data is presented for 2012–14. In 2012–14, 10.6% of Australian Indigenous children aged 5–14 years had their last dental visit due to pain.

In 2012–14, just over half (54%) of all Australian Indigenous children aged 5–14 years brushed their teeth twice or more a day

  • Slightly more female (58%) than male (51%) Indigenous children brushed their teeth twice or more a day.
  • Around half (49%) of all Indigenous children from low income households brushed their teeth twice or more a day, compared with around two-thirds from medium income households (66%) and high income households (65%).
  • Fewer Indigenous children from Remote and very remote areas (48%) brushed their teeth twice or more a day than those from Major cities (56%), Inner regional (55%) and Outer regional (58%) areas.
  • More Indigenous children whose reason for last dental visit was for a check-up (61%) brushed their teeth twice or more a day than those whose reason for last dental visit was for a dental problem (45%).

Explore the data using the Priority populations (Indigenous Australians) interactive 6 below.

Priority populations (Indigenous Australians) – Interactive 6

This figure shows the percentage of Australian Indigenous children aged 5–14 years who brush their teeth twice or more a day, by selected characteristics. National data is presented for 2012–14. In 2012–14, 54.4% of Australian Indigenous children aged 5–14 years brush their teeth twice or more a day.

From the scientific literature

Oral health changes among Indigenous and non-Indigenous Australians: findings from two national oral health surveys (Jamieson et al, 2021)

This study aimed to ascertain if the oral health of Indigenous Australians improved relative to non-Indigenous Australians between the 2004-06 and 2017-18 National Surveys of Adult Oral Health (NSAOH) (Jamieson et al, 2021). Both surveys were population-based cross-sectional surveys of Australian adults aged 15 years or more.

In 2004-06, 229 Indigenous and 13,882 non-Indigenous Australians provided self-report data, and 87 and 5,418 of these had dental examinations, respectively. In 2017-18, 334 Indigenous and 15,392 non-Indigenous Australians provided self-report data, and 84 and 4,937 of these had dental examinations, respectively.

There are some limitations to this study. There were no specific sampling strategies across either survey to ensure Indigenous Australian numbers matched population estimates. As such, estimates for Indigenous Australians might not be representative of the broader Indigenous population.

Also, there were some differences seen in the characteristics of the respondent populations which may affect the results. While the average age of Indigenous participants was the same across both surveys (40 years), there were differences seen in other characteristics, for example:

  • In 2004–06, 41% of Indigenous Australians currently smoked tobacco compared to 20% in 2017–18 
  • In 2004–06, 12% of Indigenous Australians rated their health as fair/poor compared to 27% in 2017–18

However, given that the same methodology was used across both surveys, findings are comparable in that respect.

Explore the data further in Priority populations (Indigenous Australians) interactive 7 below.

Priority Populations (Indigenous Australians) – Interactive 7

This figure shows the socio-demographic and general health-related characteristics of Indigenous and non-Indigenous Australians, aged 15 years and over. Data is presented for 2004–06 and 2017–18.

There were some improvements in the clinical oral health outcomes of Indigenous Australians, such as the severity and prevalence of periodontal disease between the 2004-06 and 2017-18 surveys, but other measures suggested their oral health status had declined overall

Self-reported oral health-related characteristics of Indigenous survey populations
  • In 2004–06, 1 in 10 (10%) Indigenous Australians reported having fewer than 21 teeth. In 2017–18, 1 in 8 (13%) Indigenous Australians reported having fewer than 21 teeth.
  • Indigenous Australians reported that they experienced toothache very often or often in 2004–06 and 2017–18, at a rate of 10% and 15% respectively,
  • In 2004–06 and 2017–18, Indigenous Australians reported that they usually visit the dentist for a problem, at a rate of  57% and 51% respectively.

Explore the data further in Priority populations (Indigenous Australians) interactive 8 below.

Priority Populations (Indigenous Australians) – Interactive 9

This figure shows the clinical dental characteristics of Indigenous and non-Indigenous Australians aged 15 years and over. Data is presented for 2004–06 and 2017–18.

Clinical dental characteristics for Indigenous Australians between the 2 surveys

  • The proportion of Indigenous Australians with moderate or severe periodontal disease decreased from 26% in 2004–06 to 11% in 2017–18
  • The proportion of Indigenous Australians missing teeth due to caries increased across the two surveys from 92% in 2004–06 to 98% in 2017–18,

Explore the data further in Priority populations (Indigenous Australians) interactive 9 below.