Summary
Diabetes
is an Australia's health
topic
On this page:
Diabetes
Diabetes is a chronic condition marked by high levels of glucose (sugar) in the blood. It is caused by the inability to produce insulin (a hormone made by the pancreas to control blood glucose levels) or by the body's inability to use insulin effectively, or both.
The main types of diabetes are type 1 diabetes, type 2 diabetes, gestational diabetes and other diabetes.
See What is diabetes? for more information.
How common is diabetes?
In 2021, an estimated 1 in 20 (5.1% or just over 1.3 million) Australians were living with diagnosed diabetes (prevalence) and were registered with the National Diabetes Services Scheme (NDSS) and Australasian Paediatric Endocrine Group (APEG) state-based registers. This includes people with type 1 diabetes, type 2 diabetes and other diabetes, but excludes gestational diabetes.
In 2021, the prevalence of diabetes increased with age with almost 1 in 5 Australians aged 80–84 living with diabetes – almost 30 times as high as for those aged under 40. Diabetes was 1.3 times as common in males compared with females, after controlling for age.
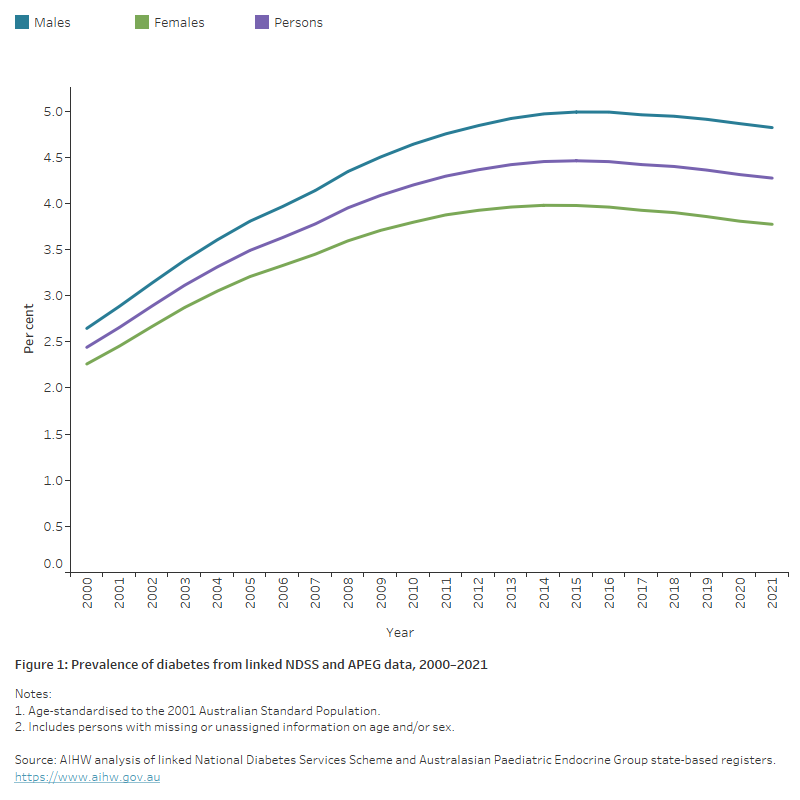
The age-standardised prevalence rate of diabetes increased by over 80% between 2000 and 2012 and has remained largely unchanged in the 10 years since then (Figure 1).
Note: The rates presented above are likely to underestimate the true prevalence of diabetes in the Australian population due to a range of factors. See Limitations of estimating diabetes prevalence for more information.
Figure 1: Prevalence of diabetes from linked NDSS and APEG data, 2000 to 2021
This chart shows the estimated age–standardised proportion of people with diabetes based on data from the linked National Diabetes Services Scheme and Australasian Paediatric Endocrine Group between 2000 and 2021. The proportion increased from 2.4% in 2000 to 4.3% in 2021 and has remained relatively stable since 2014.
Type 1 diabetes
Around 58,600 people were newly diagnosed (incidence) with type 1 diabetes between 2000 and 2021 according to the National (insulin–treated) Diabetes Register (NDR).
In 2021, there were 3,000 people newly diagnosed with type 1 diabetes in Australia, equating to 12 diagnoses per 100,000 population.
The incidence of type 1 diabetes remained relatively stable across the last 2 decades, fluctuating between 11 and 13 new cases per 100,000 population.
See Type 1 diabetes for more information.
Type 2 diabetes
Just over 1.3 million people were newly diagnosed with type 2 diabetes between 2000 and 2021, according to linked NDSS and APEG data. This was an average of around 60,000 people each year.
However in 2021, the number of people newly diagnosed with type 2 diabetes in Australia was well below this average at 45,700, equating to 178 people diagnosed per 100,000 population.
There has been a steady decline in the age-standardised incidence rate for type 2 diabetes in Australia between 2000 and 2021, with an overall drop of 43%. Although evidence from the 2019 Global Burden of Disease study as reported in The Lancet (2020) shows an overall increase in incidence globally, the observed declining trend has also been reported in a number of other countries (Magliano et al. 2019; Magliano et al. 2021). The fall in incidence may be due to improved preventive measures such as screening, increased awareness and educational programs leading to behavioural changes and risk factor modification (Magliano et al. 2019; Shrapnel and Butcher, 2020).
See Type 2 diabetes for more information.
Gestational diabetes
More than 1 in 6 (17.9% or 53,900) females aged 15–49 who gave birth in hospital in 2021–22 had been diagnosed with gestational diabetes during their pregnancy, according to the National Hospital Morbidity Database (NHMD).
After adjusting for changes in the age structure of the population over time, the incidence of gestational diabetes more than doubled in Australia between 2012–13 and 2021–22.
The rising incidence of gestational diabetes in the last decade is likely driven by several factors including increasing maternal age, higher rates of maternal overweight and obesity, and a growing proportion of higher risk ethnic groups in the population (Laurie and McIntyre 2020). The introduction of new diagnostic guidelines across all states and territories between 2011 and 2013 is also likely to have had an impact on rates.
See Incidence of gestational diabetes in Australia – Changing trends and Gestational diabetes for more information.
Impact of diabetes
Burden of disease
Burden of disease refers to the quantified impact of living with and dying prematurely from a disease or injury and is measured using disability-adjusted life years (DALY). One DALY is equivalent to one year of healthy life lost.
In 2023, type 2 diabetes was responsible for around 124,000 years of healthy life lost in Australia (4.7 DALY per 1,000 population). Contributing 2.2% to the total disease burden in Australia, type 2 diabetes was the 11th leading specific cause. After accounting for differences in the age structure of the population, the overall rate of burden due to type 2 diabetes remained stable between 2003 and 2023 (3.9 and 3.7 DALY per 1,000 population, respectively). In terms of the total DALY number attributed to type 2 diabetes, there was a 61% increase between 2003 and 2023 (+47,000 DALY) (AIHW 2023).
The change in the total DALY number attributed to type 2 diabetes between 2003 and 2018 (+45%), was driven by population growth (+29%) and population ageing (+17%) and less impacted by the prevalence of type 2 diabetes in the population (-1.0%) (AIHW 2021b).
Type 1 diabetes was responsible for around 19,000 DALY in 2023, equating to 0.7 per 1,000 population. The age-standardised rate (0.7 per 1,000) is similar to that recorded in 2003. Type 1 diabetes contributed to 0.3% of the total disease burden in Australia in 2023 (AIHW 2023).
See Burden of diabetes.
Expenditure
In 2020–21, an estimated $3.4 billion of expenditure in the Australian health system was attributed to diabetes, representing 2.3% of total disease expenditure. The breakdown in expenditure by diabetes type included:
- type 2 diabetes 68%
- type 1 diabetes 11%
- gestational diabetes 2.1%
- other and unspecified diabetes 20% (AIHW 2023b).
Note: Numbers may not add to 100 due to rounding.
See Health system expenditure.
Adverse effects in pregnancy
Based on data from the NHMD for 2020–21, mothers with pre-existing diabetes (and to a lesser extent, gestational diabetes) were more prone to complications during pregnancy and intervention in childbirth with higher rates of caesarean section, induced labour, pre-existing and gestational hypertension, and pre-eclampsia compared with mothers with no diabetes in pregnancy.
Babies of mothers living with diabetes in pregnancy are also at an increased risk of childhood metabolic syndrome, obesity, impaired glucose tolerance, and type 2 diabetes in later life (Clausen et al. 2007; Kim et al. 2012; Zhao et al. 2016).
Deaths
According to the AIHW National Mortality Database, in 2021, diabetes was the underlying cause of around 5,400 deaths. However, it contributed to around 19,300 deaths (11.2% of all deaths) when associated causes are also considered (AIHW 2021e).
See Life expectancy and causes of death.
Treatment and management of diabetes
HbA1c testing
According to the National Prescribing Service (NPS) MedicineWise's MedicineInsight general practice insights report (NPS MedicineWise, 2022) in 2020–21, 71% of general practice patients with a diagnosis of diabetes (20 years and older) had at least one test result for HbA1c levels (the main biomarker used to assess long-term glucose control). Among MedicineInsight patients without a diagnosis of diabetes, 14% had received at least one test for HbA1c levels (up from 11% in 2019–20).
According to the Australian National Diabetes Audit – Australian Quality Clinical Audit (ANDA–AQCA) 2021, among all adult patients with recorded diabetes (n=4,262), the median HbA1c level was 63.0 mmol/mol. Median HbA1c was slightly higher among patients with type 1 diabetes (66.0 mmol/mol) and slightly lower in patients with type 2 diabetes (62.0 mmol/mol). Patients with gestational diabetes had significantly lower median HbA1c levels (34.0 mmol/mol) (ANDA 2021).
See Ongoing monitoring.
Medicines
In 2020–21, there were over 16.5 million prescriptions dispensed for diabetes medicines through Section 85 of the Pharmaceutical Benefits Scheme and Repatriation Pharmaceutical Benefits Scheme, representing 5.3% of total prescriptions. Metformin, a glucose-lowering medication for patients with type 2 diabetes, was the seventh most dispensed medicine in 2020–21 (Department of Health 2021b).
According to the NDR, 31,700 people began using insulin to treat their diabetes in 2021. Of the people with diabetes who began using insulin, 49% had type 2 diabetes, 39% had gestational diabetes, 10% were newly diagnosed with type 1 diabetes and 2% had other forms of diabetes.
See Medicine use.
Hospitalisations and procedures
Almost 1.3 million hospitalisations were associated with diabetes in 2020–21, with 4.7% recording diabetes as the principal diagnosis and around 95% recording diabetes as an additional diagnosis, according to the NHMD. This represents 11% of all hospitalisations in Australia.
Of these, around 1.1 million recorded type 2 diabetes as the principal and/or additional diagnosis and 64,600 hospitalisations recorded type 1 diabetes as the principal and/or additional diagnosis.
People with diabetes may require procedures to manage their diabetes or treat the complications of diabetes. According to the NHMD, there were 4,500 weight loss procedures and 5,300 lower limb amputations undertaken for people with type 2 diabetes in 2020–21 (18 and 21 per 100,000 population, respectively).
See Hospitalisations.
Variation between population groups
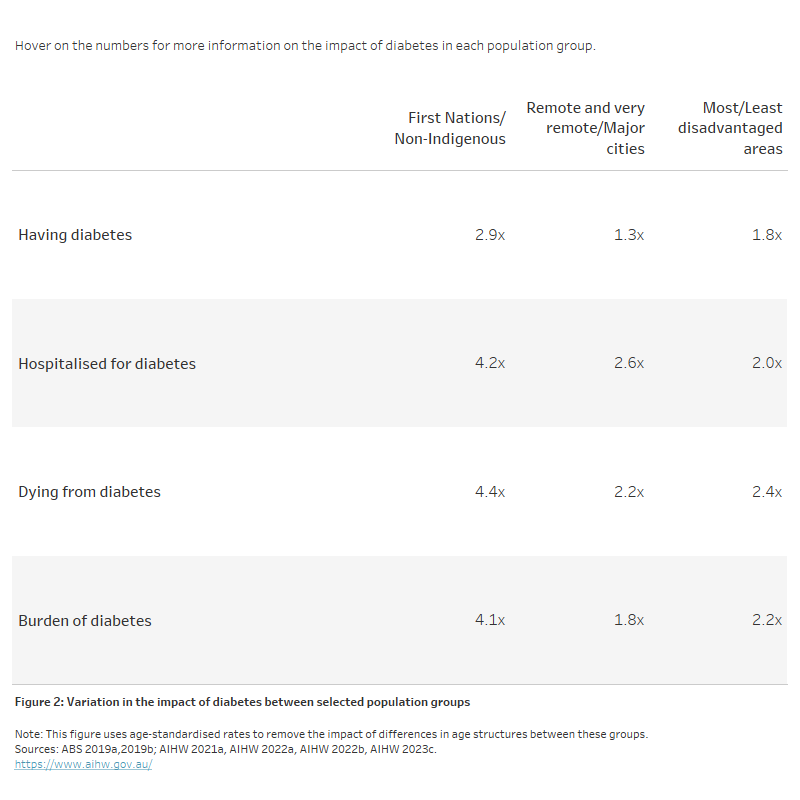
The impact of diabetes varies between population groups. To account for differences in the age structures of these groups, the data presented below is based on age-standardised rates.
In recent years, the impact of diabetes has been higher among Aboriginal and Torres Strait Islander people, those living in lower socioeconomic areas and those living in remote areas (Figure 2). The diabetes prevalence rate was 2.9 times as high among Indigenous Australians as non–Indigenous Australians based on age–standardised self–reported data from the 2018–19 National Aboriginal and Torres Strait Islander Health Survey (ABS 2019b).
Generally, the impact of diabetes increases with increasing remoteness and socioeconomic disadvantage. Deaths related to diabetes were 2.2 times as high in Remote and very remote areas compared with Major cities, and 2.4 times as high in the lowest compared with the highest socioeconomic areas (Figure 2).
Figure 2: Variation in the impact of diabetes between selected population groups
The table shows the age-standardised rate ratios for all diabetes by selected population group. Rate ratios are presented for prevalence, hospitalisations, deaths and burden of disease. Overall, rates increased for each measure by increasing remoteness and socioeconomic disadvantage while rates were also higher among First Nations people compared with non-Indigenous people.
Impact of COVID–19
The onset of the COVID–19 pandemic has significantly impacted the Australian health system, including mortality, hospitalisations, health services, disease management and surveillance. Diabetes is one of many conditions correlated with greater health consequences throughout the COVID-19 pandemic including increased risk of complication and mortality (Peric and Stulnig 2020).
See Impact of COVID–19.
Where do I go for more information?
For more information on diabetes, see:
- Incidence of insulin–treated diabetes in Australia
- Indicators for the Australian National Diabetes Strategy 2016–2020: data update
- Incidence of gestational diabetes in Australia
Visit Diabetes for more on this topic.
ABS (Australian Bureau of Statistics) (2013) Australian Health Survey: biomedical results for chronic diseases, 2011–12, ABS catalogue number 4364.0.55.005, ABS, Australian Government, accessed 7 January 2022.
ABS (2019a) Microdata: National Health Survey, 2017–18, ABS catalogue number 4324.0.55.001, Findings based on detailed microdata file analysis, ABS, Australian Government, accessed 7 January 2022.
ABS (2019b) National Aboriginal and Torres Strait Islander Health Survey, 2018–19, ABS catalogue number 4715.0, ABS, Australian Government, accessed 7 January 2022.
AIHW (Australian Institute of Health and Welfare) (2018) Diabetes indicators for the Australian National Diabetes Strategy 2016–2020, Catalogue number CVD 81, AIHW, Australian Government, accessed 10 January 2022.
AIHW (2021a) Australian Burden of Disease Study: impact and causes of illness and death in Australia 2018, Australian Burden of Disease Study series no. 23, Catalogue number BOD 29, AIHW, Australian Government, accessed 07 January 2022.
AIHW (2021b) Australian Burden of Disease Study 2018: Interactive data on risk factor burden, AIHW, Australian Government, accessed 16 December 2021.
AIHW (2022a) Australian Burden of Disease Study: impact and causes of illness and death in Aboriginal and Torres Strait Islander people 2018, AIHW, Australian Government, accessed 11 March 2022.
AIHW (2022b) National Hospital Morbidity Database, AIHW, Australian Government, accessed 20 October 2022.
AIHW (2023a) Australian Burden of Disease Study 2023, AIHW, Australian Government, accessed 14 December 2023.
AIHW (2023b) Health system spending on disease and injury in Australia 2020–21, AIHW, Australian Government, accessed 30 November 2023.
AIHW (2023c) National Mortality Database, Findings based on unit record analysis, AIHW, Australian Government, accessed 11 April 2023.
Clausen TD, Mathiesen ER, Hansen T, Pedersen O, Jensen DM, Lauenborg J and Damn P (2007) 'High prevalence of type 2 diabetes and pre–diabetes in adult offspring of women with gestational diabetes mellitus or type 1 diabetes–the role of intrauterine hyperglycaemia', Diabetes care, 31(2):340–46, doi:10.2337/dc07-1596.
Department of Health (2021) PBS expenditure and prescriptions report 1 July 2020 to 30 June 2021, Department of Health, Australian Government, accessed 5 January 2022.
Kim SY, Sharma AJ and Callaghan WM (2012) 'Gestational diabetes and childhood obesity: what is the link?', Current Opinion in Obstetrics and Gynaecology, 24(6):376–81, doi:10.1097/GCO.0b013e328359f0f4.
Laurie J and McIntyre D (2020) ‘A Review of the Current Status of Gestational Diabetes Mellitus in Australia–The Clinical Impact of Changing Population Demographics and Diagnostic Criteria on Prevalence’, International Journal of Environmental Research and Public Health’ 17(24):9387, doi:10.3390/ijerph17249387
Magliano DJ, Islam RM, Barr EL, Gregg EW, Pavkov ME, Harding JL, Tabesh M, Koye DN, Shaw JE (2019), Trends in incidence of total or type 2 diabetes: systematic review. BMJ, 366:I5003, doi: https://doi.org/10.1136/bmj.l5003
Magliano DJ, Chen L, Islam R, Carstensen B, Gregg E, Pavkov M, Andes L, Balicer R, Baviera M et al. (2021), Trends in the incidence of diagnosed diabetes: a multicountry analysis of aggregate data from 22 million diagnoses in high-income and middle-income settings, Lancet Diabetes Endocrinol., 9(4):203–211, https://doi.org/10.1016/S2213-8587(20)30402-2.
NPS MedicineWise (2022) MedicineInsight General Practice Insights Report July 2020–June 2021, NPS MedicineWise, accessed 4 October 2022.
Peric S and Stulnig TM (2020) 'Diabetes and COVID-19', Wiener Klinische Wochenschrift, 132(13):356-61, doi:10.1007/s00508-020-01672-3.
Shrapnel WS and Butcher BE (2020), Sales of Sugar-Sweetened Beverages in Australia: A Trend Analysis from 1997 t 2018. Nutrients, 12(4): 1016, doi:10.3390/nu12041016.
The Lancet (2020), GBD cause and risk summaries: Diabetes mellitus–Level 3 cause, The Lancet website, accessed 24 May 2023.
Zhao P, Liu E, Qiao Y, Katzmarzyk PT, Chaput J–P, Fogelholm M, Johnson WD, Kuriyan R, Kurpad A, Lambert E, Maher C, Maia JAR , Matsudo V, Olds T, Onywera V, Sarmiento OL, Standage M, Tremblay MS, Tudor-Locke C and Gang Hu G (2016), 'Maternal gestational diabetes and childhood obesity at age 9–11: results of a multinational study', Diabetologia, 59:2339–48, doi:10.1007/s00125-016-4062-9.