Indicator 1.6 Inadequate fruit and/or vegetable consumption, by age group
Considerations
The 2013 Australian Dietary Guidelines recommend a minimum number of daily serves of fruit (1–2 for children and 2 for adults) and vegetables (2.5–5.5 for children; 5–6 or more for men depending on age, and 5 or more for women) (NHMRC 2013). For more information on the dietary guidelines for different age groups, see the Australian Dietary Guidelines.
Overview
In 2017–18, most Australians aged 2 and over (95%) failed to meet the 2013 Australian Dietary Guidelines for adequate fruit and vegetable intake, based on self-reported data from the National Health Survey (NHS) .
Trends
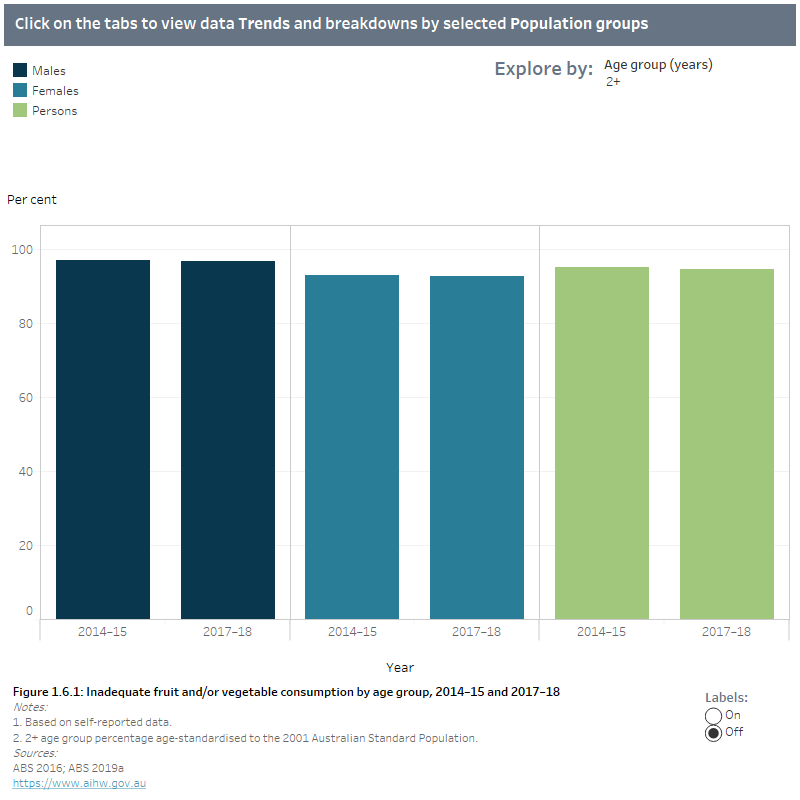
The age-standardised proportion of Australians with inadequate fruit and/or vegetable intake remained the same (95%) between 2014–15 and 2017–18 (Figure 1.6.1).
Age and sex
The age-standardised proportion of males with inadequate fruit and/or vegetable intake was significantly higher than the proportion of females (97% and 93%, respectively). The proportion of Australians meeting the guidelines for adequate fruit and/or vegetable intake were similar across age groups (Figure 1.6.1).
Population groups
Inadequate fruit and vegetable consumption was slightly higher in the lowest socioeconomic areas compared with the highest socioeconomic areas (96% compared with 94%). There were no significant differences by remoteness area (Figure 1.6.2).
State and territory
After adjusting for age, there were no significant differences in the proportion of Australians meeting the guidelines for adequate fruit and/or vegetable intake by state and territory in 2017–18 (Figure 1.6.2).
Aboriginal and Torres Strait Islander people
In 2018–19, 96% of Indigenous Australians did not meet the guidelines for adequate fruit and/or vegetable intake, based on self-reported data from National Aboriginal and Torres Strait Islander Health Survey (NATSIHS). After adjusting for age, a slightly higher proportion of Indigenous males than females did not meet the recommended intake (98% and 95%, respectively) (Figure 1.6.2).
Based on estimates from the 2017–18 NHS and 2018–19 NATSIHS, the age-standardised proportion of inadequate fruit and/or vegetable intake was higher among Indigenous Australians compared with non-Indigenous Australians (97% and 95%, respectively) (Figure 1.6.2).
Explore the data